Top 3 Price Prediction Bitcoin, Ethereum, XRP: Cryptos at risk of breaking critical support
- Bitcoin price action mixed, solid cases for bear or bulls to take over.
- Ethereum price in a similar conundrum as Bitcoin.
- XRP price presents a buying opportunity before hitting $0.75

Bitcoin price is at dire risk of initiating a very bearish breakout if it fails to stay above $37,500. Likewise, Ethereum price action, like Bitcoins, is at an inflection point that will cause pain to either bulls or bears once an established breakout occurs. XRP price has stubbornly defended the $0.60 value area and appears to have succeeded at holding that zone.
Bitcoin price warning of bearish continuation – but bulls are set up for a surprise rally
Bitcoin price is currently trading in a frustrating zone of consolidation. While it remains bullish on a 3-week perspective, the weekly and daily charts remain overwhelmingly bearish but highly oversold. Strong arguments can be made for short sellers to maintain control and bulls to terminate the current trend and reverse it. As a result, two possible trade opportunities are now present.
The first possible trade setup is on the short side of the trade. The short idea is a hypothetical short entry is a sell stop order at $35,000, a stop loss at $38,000, and a profit target at $20,000. Technically, the Vertical Profit Target Method in Point and Figure analysis shows $15,000 as the target, but a considerable amount of resistance would almost certainly prevent a collapse to that price zone in a single trend.
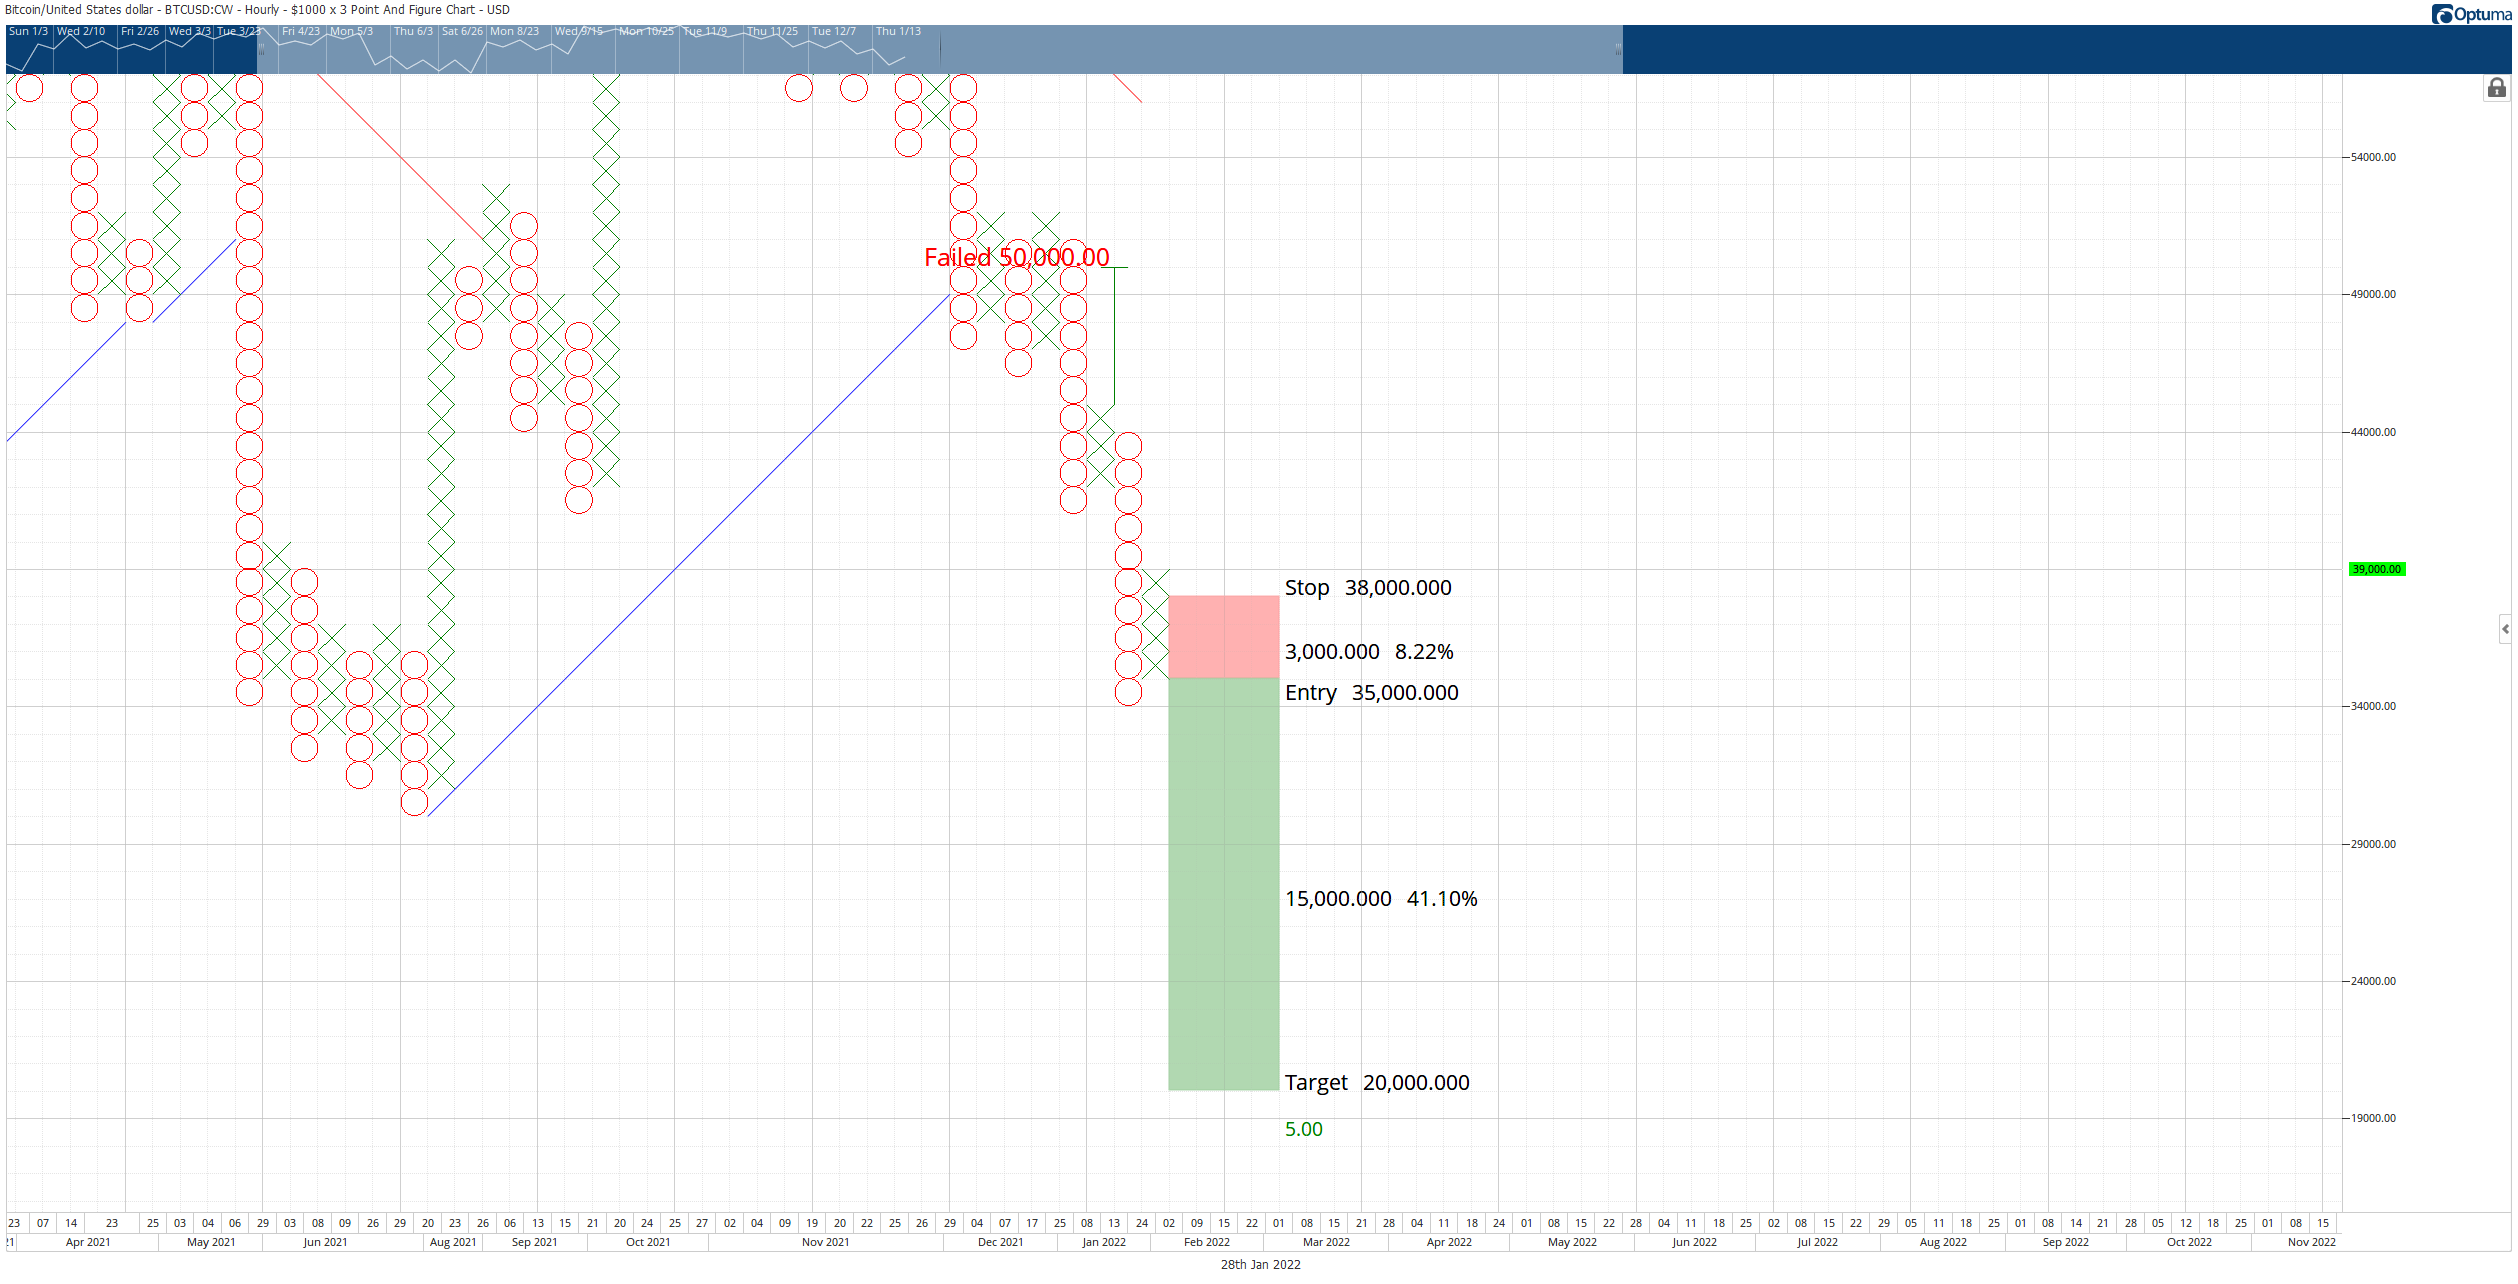
BTC/USD $1,000/3-box Reversal Point and Figure Chart
The short entry idea is based on a Pole Pattern reversal. The rule for this trade setup is that the current X-column can not print another X above 50% of the prior O-column. In other words, if Bitcoin price prints an X at $40,000, the hypothetical short entry is invalidated.
On the long side of the trade, the theoretical long setup is a buy stop order at $38,000, a stop loss at $36,000, and a profit target at $48,500. The trade represents a 5.25:1 reward/risk setup. A two to three-box trailing stop would help protect any implied profit post entry. While the Vertical Profit Target Method identifies $48,500 as the max potential, it is more probable that Bitcoin price will be halted somewhere just below the bear market trendline – somewhere between $43,000 and $45,000.
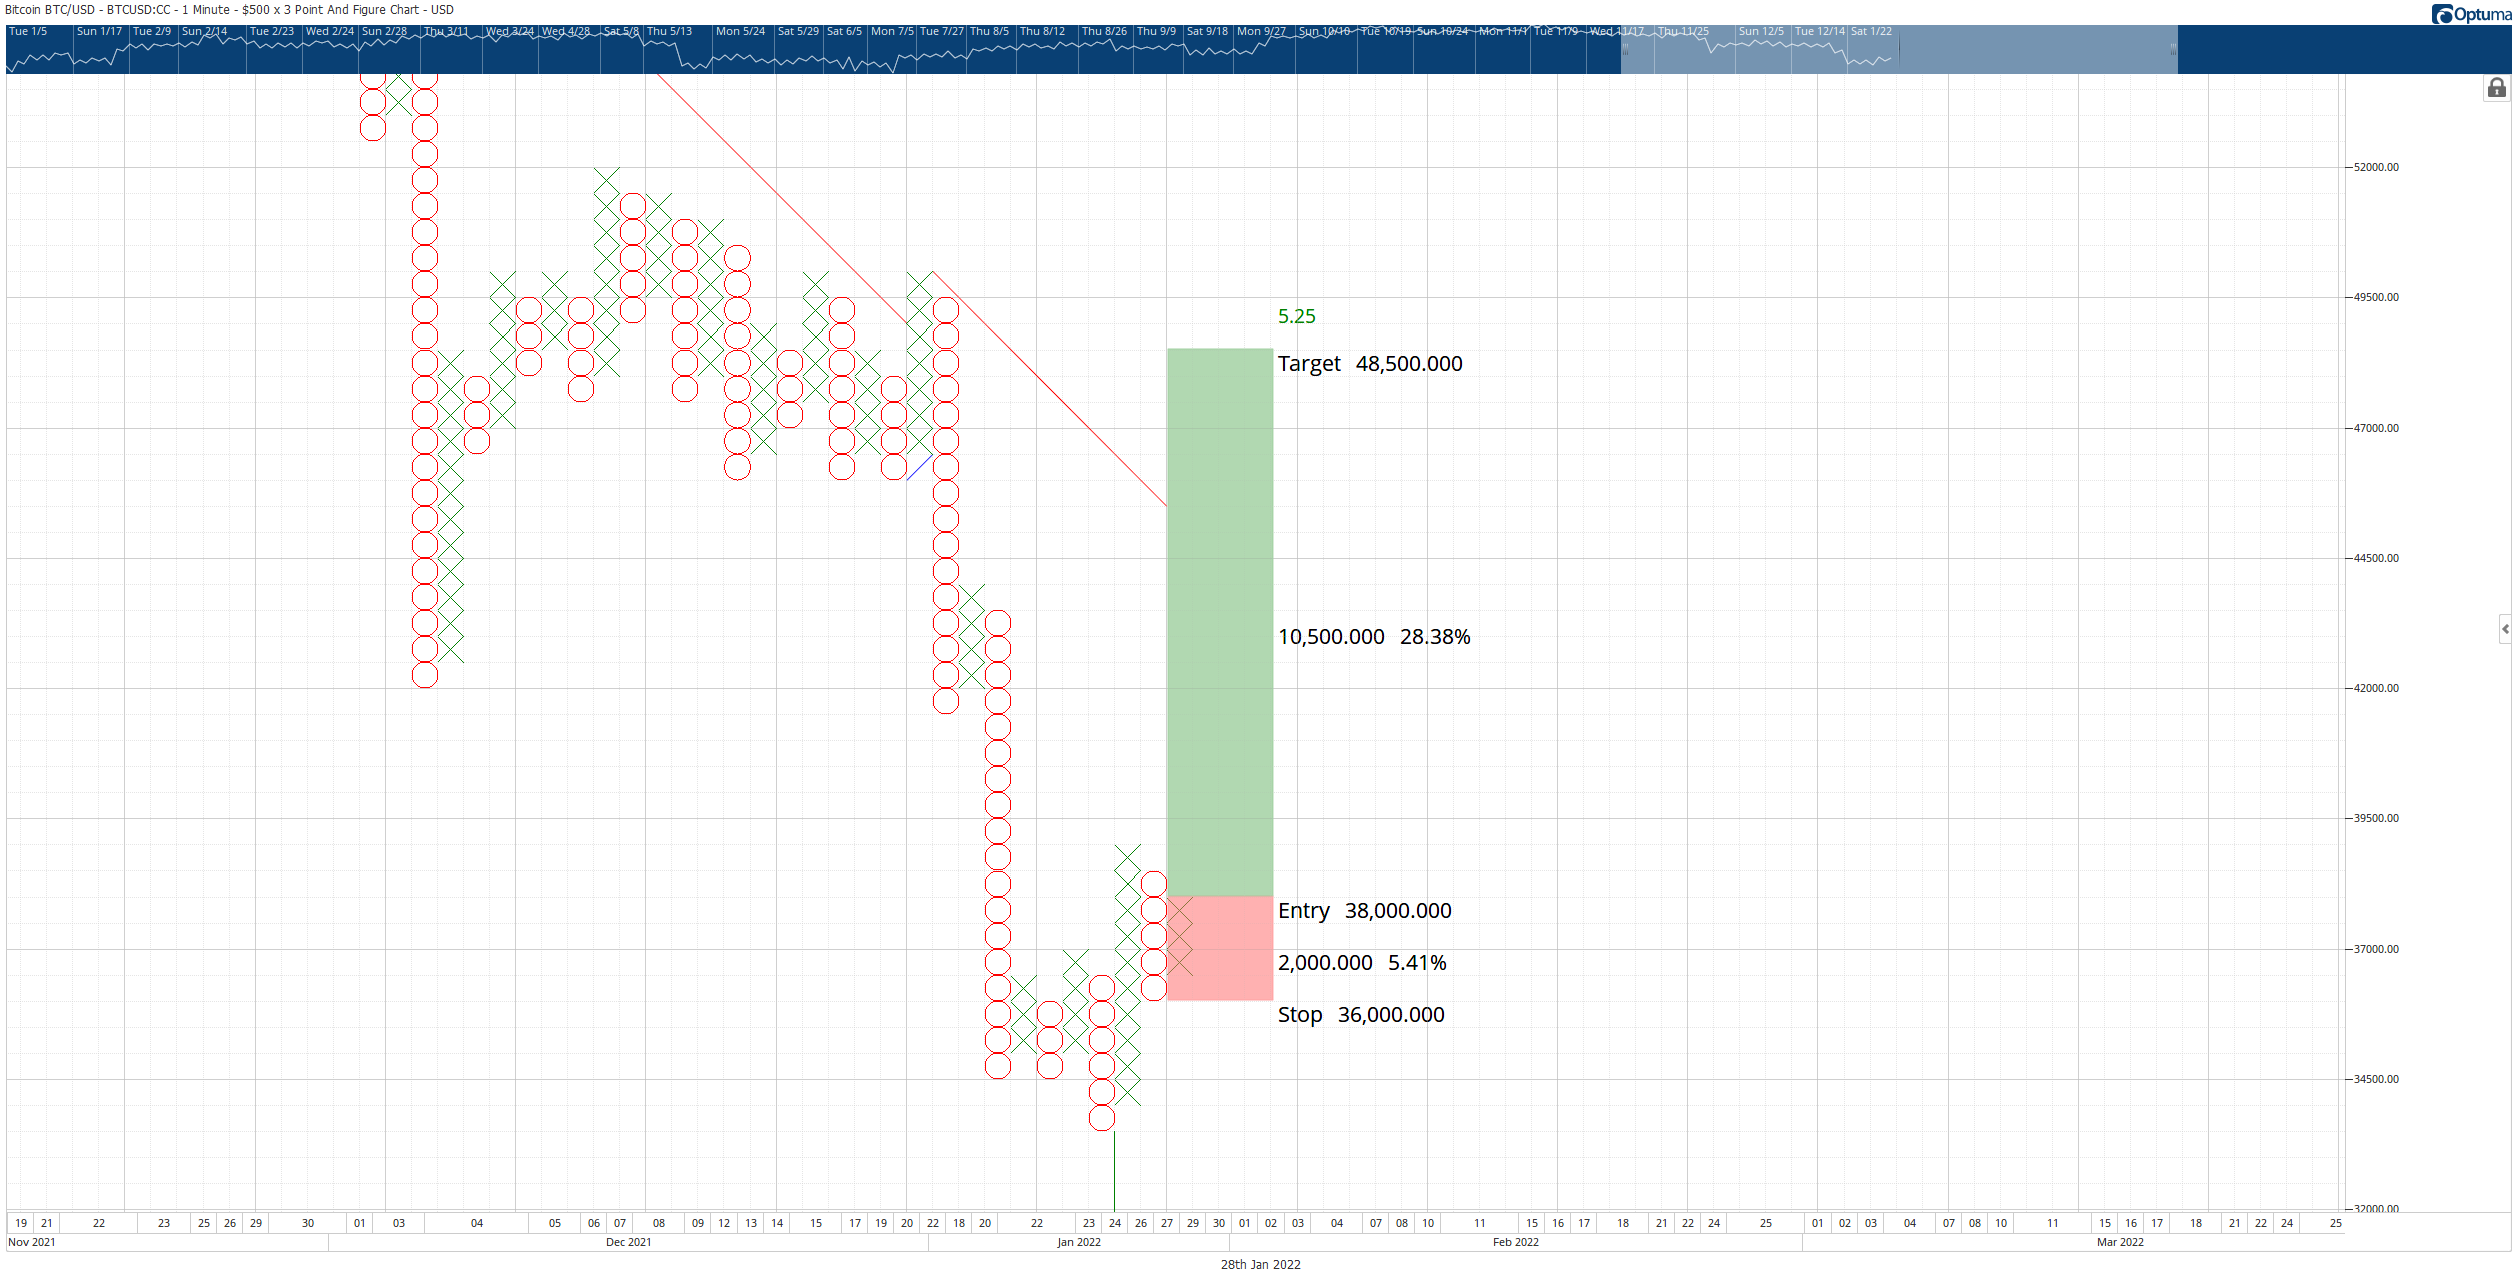
BTC/USD $500/3-box Reversal Point and Figure Chart
The theoretical long trade setup is invalidated if Bitcoin price drops below $31,000.
Ethereum price presents long and short trade opportunities
Ethereum price is almost identical to Bitcoin, except that ETH is above Senkou Span B on its weekly Ichimoku chart. Ethereum must close its weekly candlestick above $2,350, or it will enter into the weakest position since 2019. However, bulls are positioned to invalidate any bearish continuation. Two trade setups for both sides of the market are now present.
The first theoretical trade for Ethereum price is a buy stop order at $2,550, a stop loss at $2,350, and a profit target at $3,250. The trade setup represents a 3.5:1 reward/risk. A two-box trailing stop would help protect any implied profit made upon the entry triggering. Additionally, expect some resistance around the $3,000 to $3,050 value areas as they close to the bear market trend line (red diagonal line).
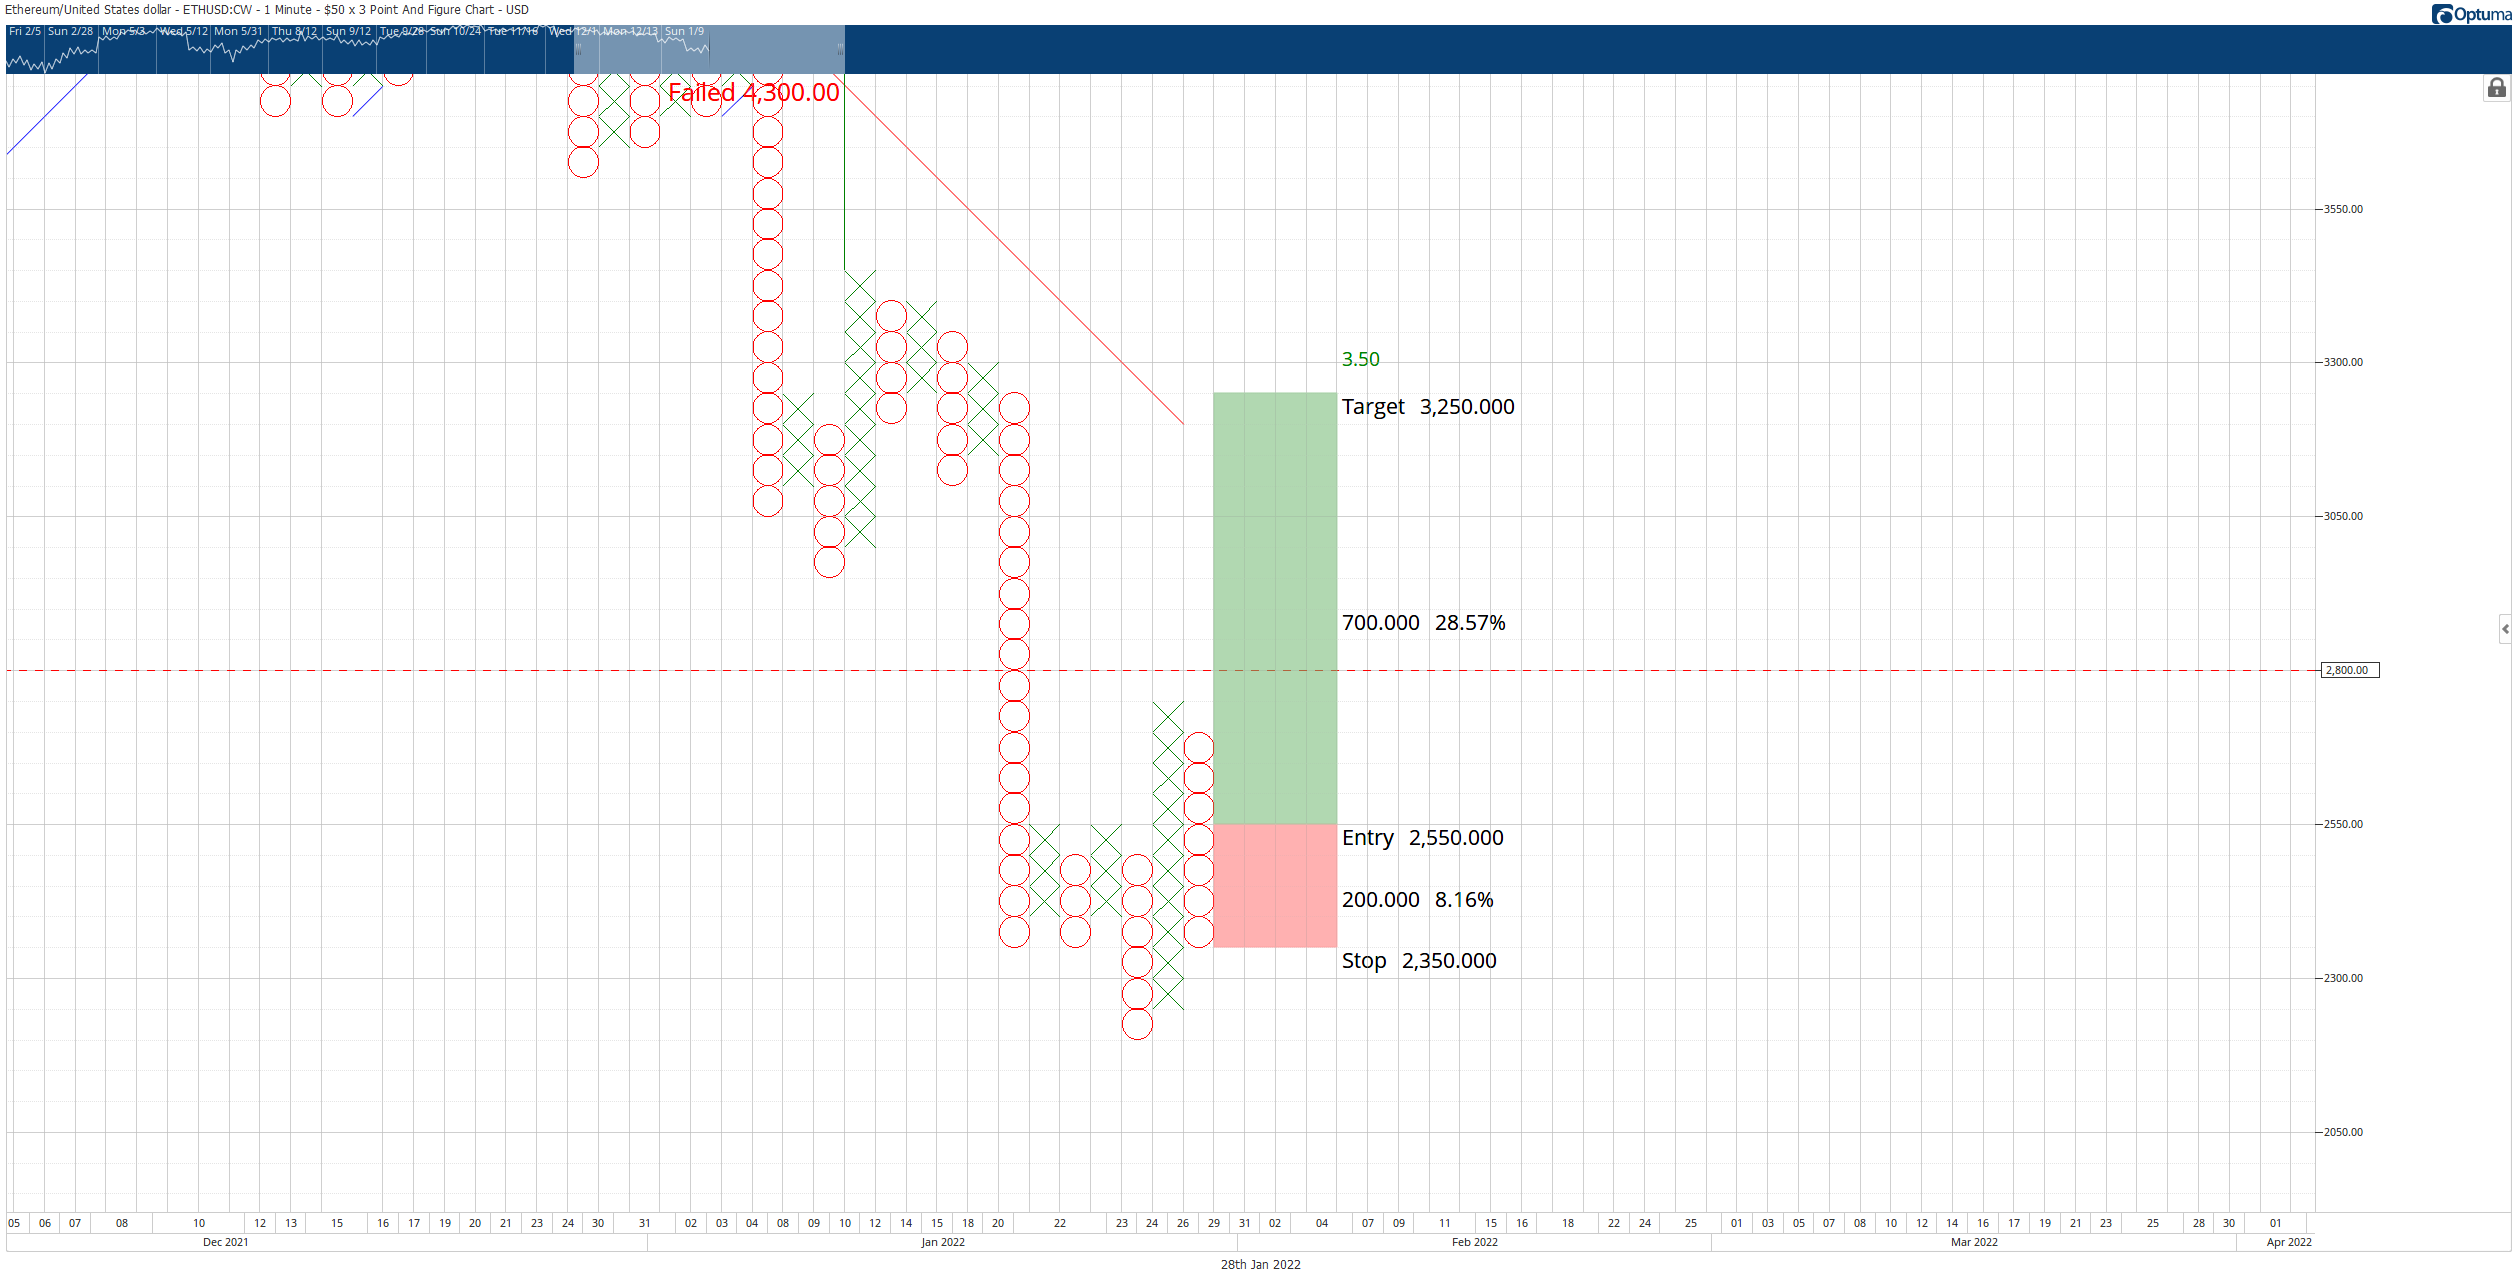
ETH/USD $50/3-box Reversal Point and Figure Chart
The long idea is invalidated if Ethereum price prints an O at $2,300.
On the short side of the trade, the hypothetical setup is a short entry at $2,300, a stop loss at $2,700, and a profit target at $1,200. The profit target is a bit of a caveat on this trade setup: it’s not likely to get to the projected zone despite it being within the range of profit projection in Point and Figure analysis.
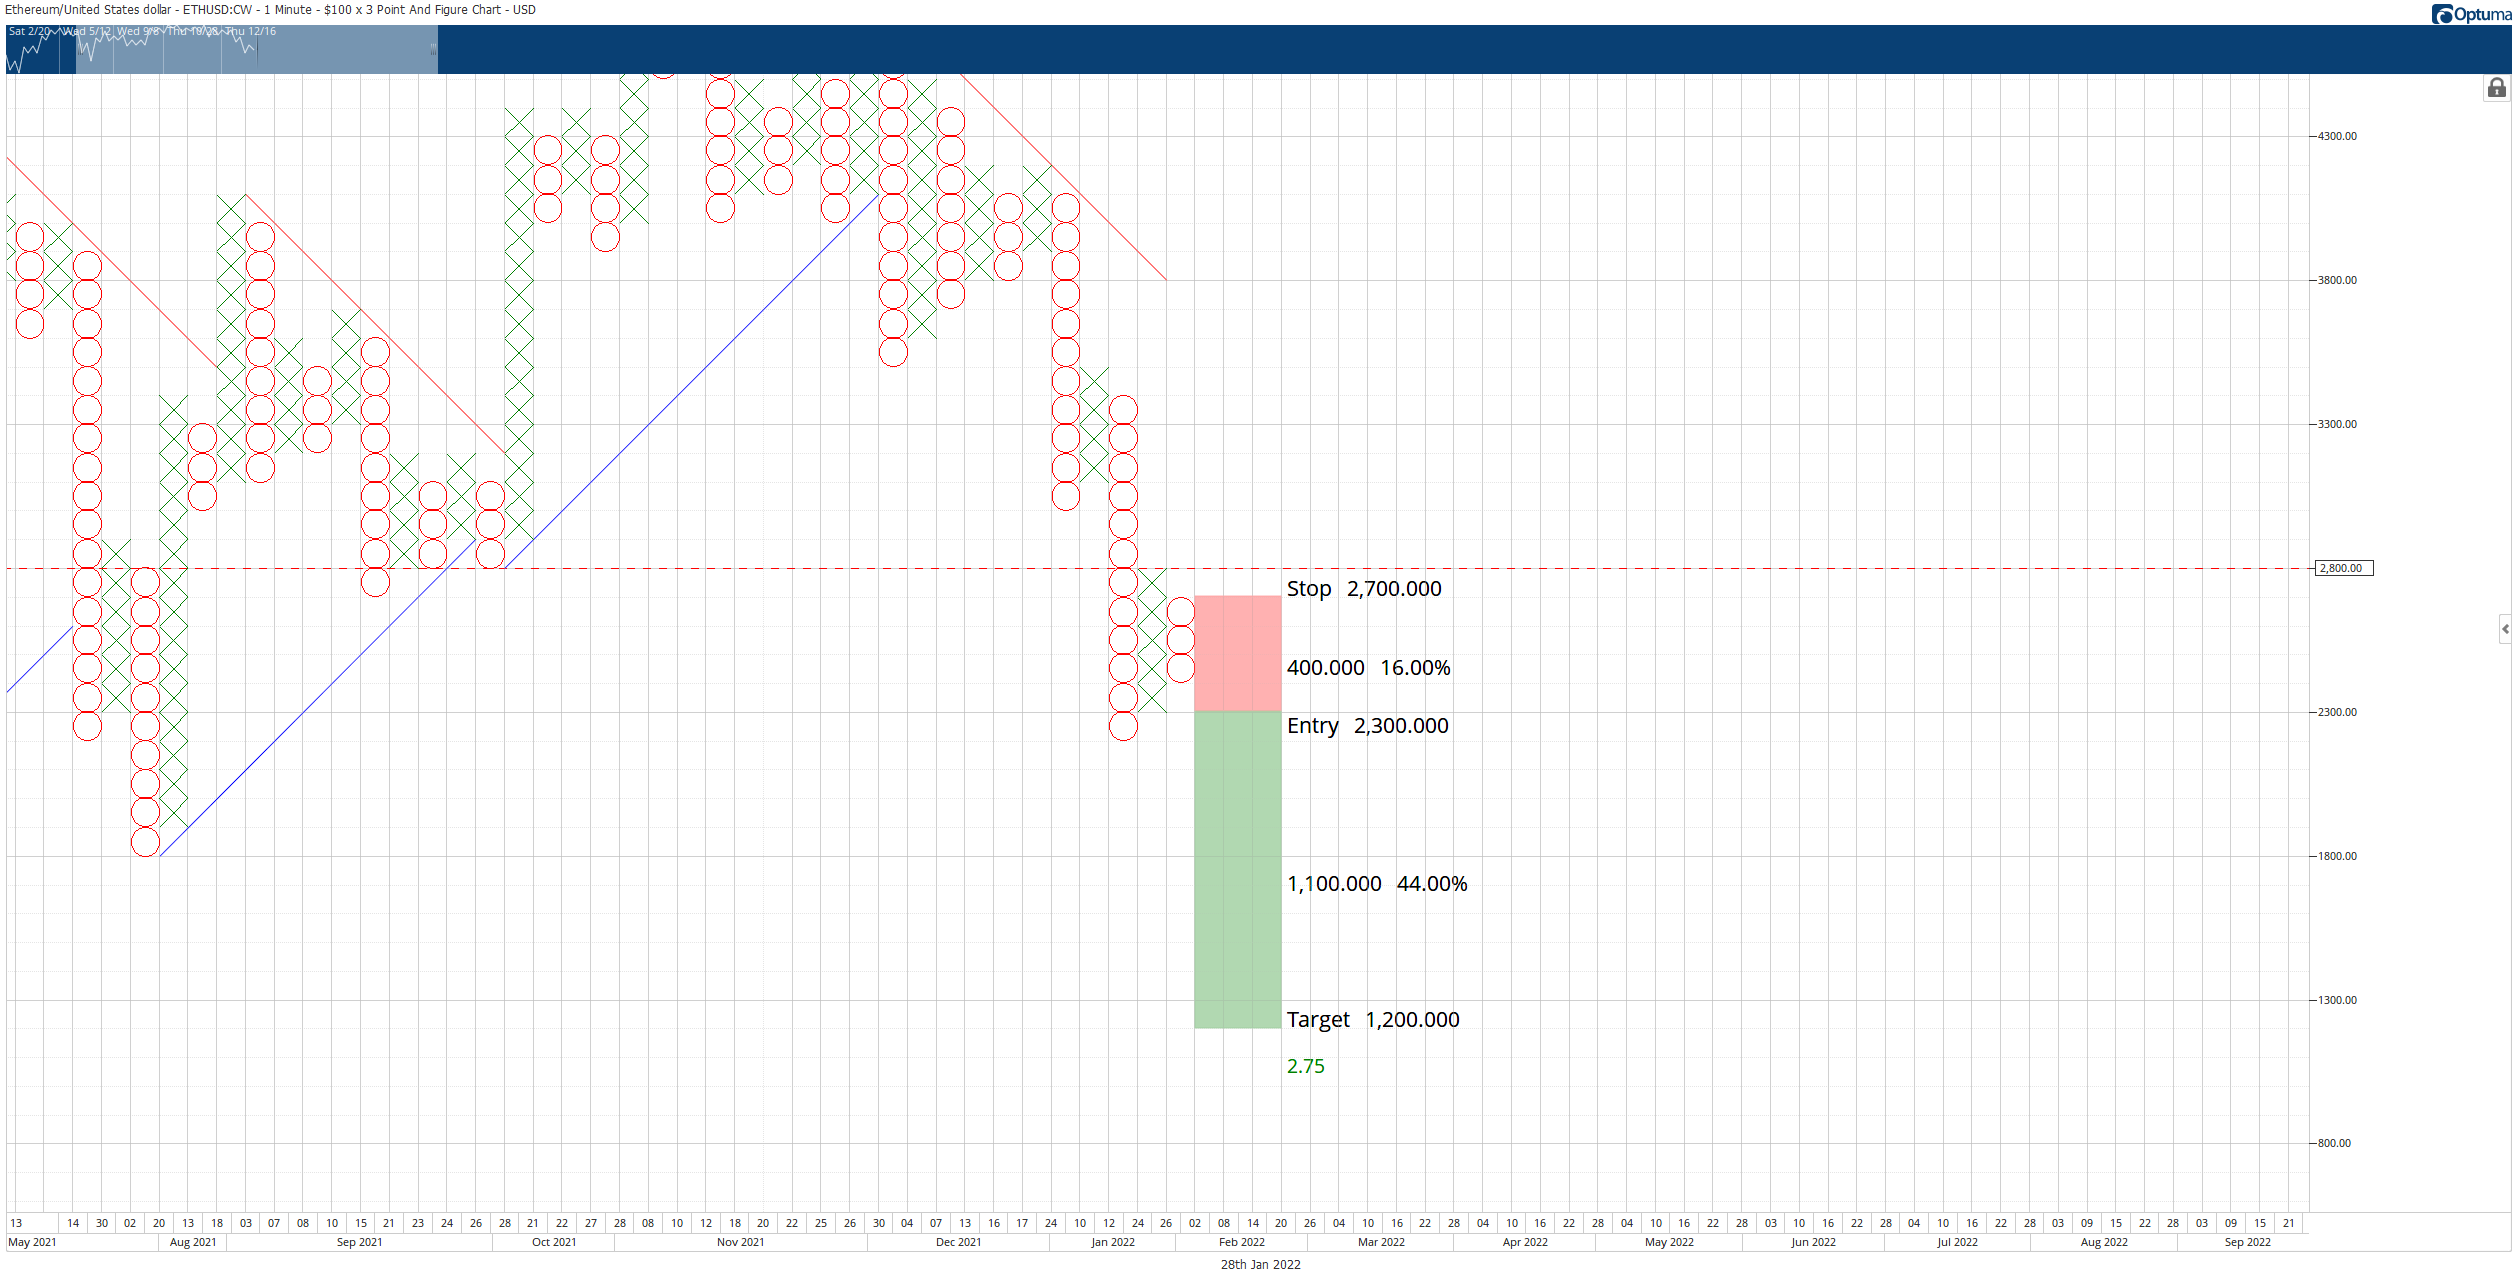
ETH/USD $100/3-box reversal Point and Figure Chart
The short idea is invalidated if the long entry triggers first.
XRP price holds on to $0.60, readies for a move to $0.75
XRP price has done a fantastic job of staving off any further selling during the week. While it is not yet out of the woods, it is positioned for a bullish reversal candlestick against a strong support zone. The first test that bulls need to pass is achieving a daily candlestick close above the Tenkan-Sen at $0.65.
However, downside risks do remain. Despite the strong support in the $0.60 zone, there remains an absence of convincing bullish continuation. So far, buyers have rejected lower prices but have not stepped in enough to support higher prices. This could be a sign of weakness going into the weekend.
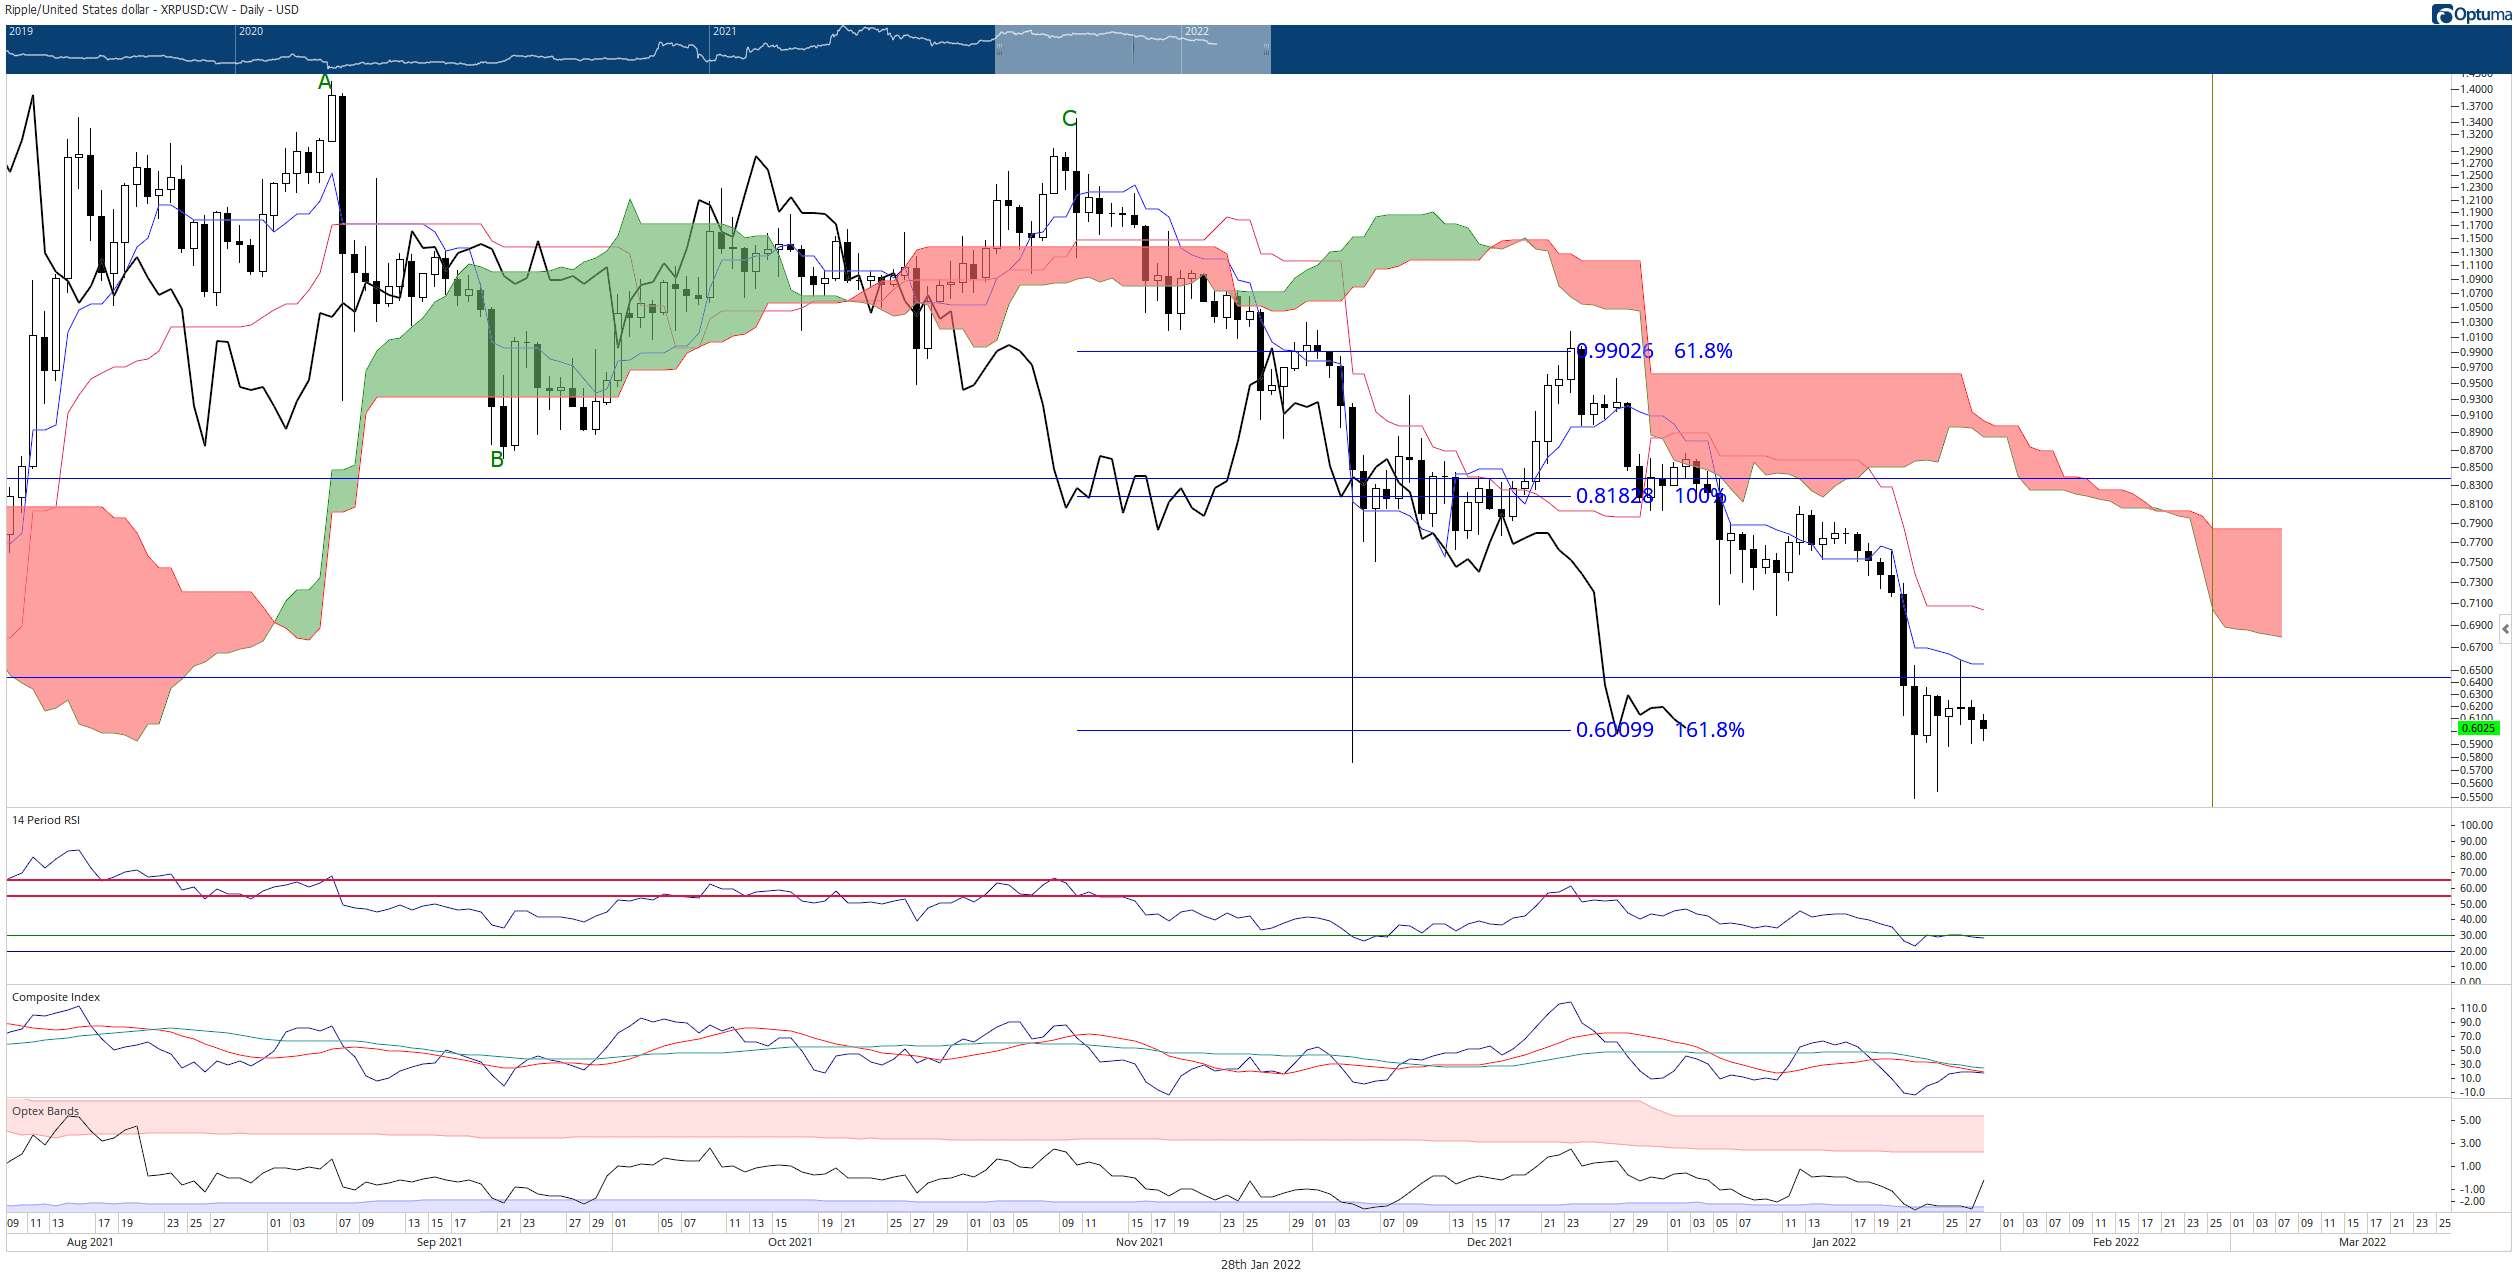
XRP/USD Daily Ichimoku Kinko Hyo Chart
Downside risks for XRP are limited to the $0.50 value area, while the upside potential is limited to the $0.75 level.
Author

Jonathan Morgan
Independent Analyst
Jonathan has been working as an Independent future, forex, and cryptocurrency trader and analyst for 8 years. He also has been writing for the past 5 years.



