Bitcoin Weekly Forecast: Federal Reserve cannot tame BTC’s uptrend
- Bitcoin price action is exposed to risk-off sentiment as more professional money is invested to Bitcoin.
- The underlying strength of Bitcoin as an asset remains strong – it is still the best performing financial instrument of the past 11 years.
- Bear markets are difficult to quantify in cryptocurrencies – standard metrics used in other markets don’t apply.

Bitcoin price has experienced some significant losses over the past few weeks, with a more dramatic drop occurring this week after the Federal Reserve’s decision was announced. As losses have extended and Bitcoin has entered into the $30,000 zone, concerns regarding Bitcoin being in a bear market have increased.
Bitcoin price action question: what is a bear market for Bitcoin?
If the same gauges to measure a bear market in the stock market were used in the cryptocurrency market, bear markets would happen on a nearly bi-weekly basis. Any drop of 20% or more from the all-time high is considered a bear market for equity markets. For Bitcoin, a 20% drop is not even a normal pullback; it’s a normal swing range.
A look at the past three bear markets show the following results in time and price (weekly charts):
June 17, 2011 – May 25, 2012: 350 days in length, the max loss was 93.8%.
November 29, 2013 – May 1, 2015 – 462 days in length, the max loss was 92.6%.
December 22, 2017 – March 1, 2019 – 427 days in length, the max loss was 84%.
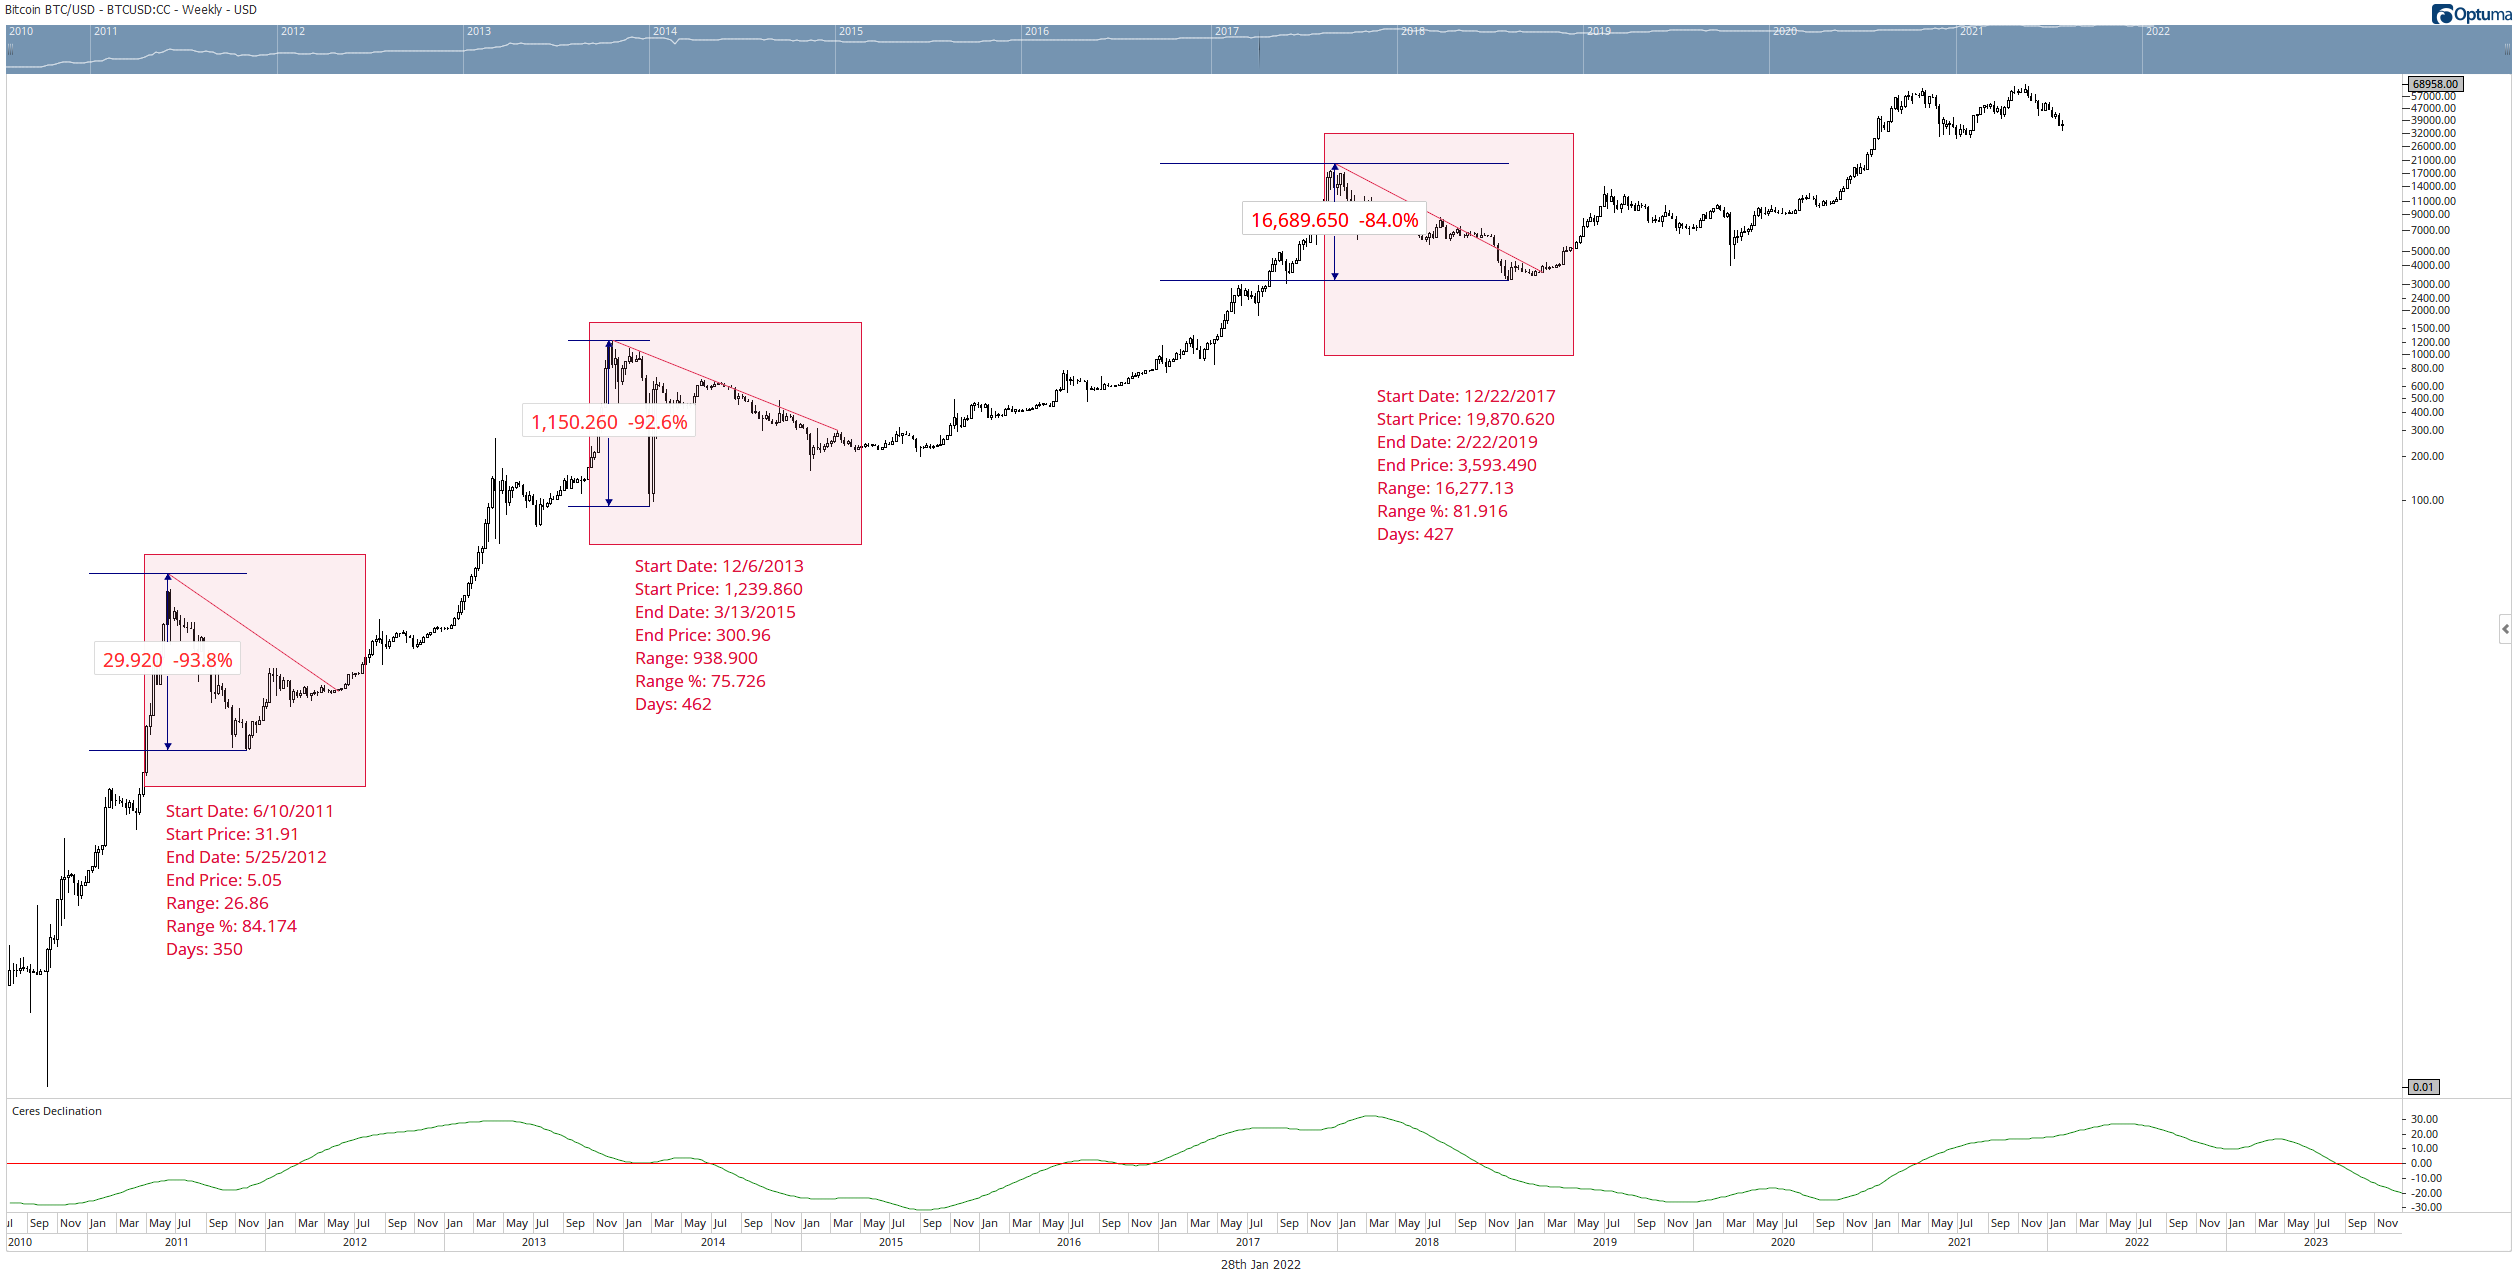
BTC/USD Weekly Chart
Compare and contrast the three primary bear markets against the corrections that Bitcoin faces in an uptrend:
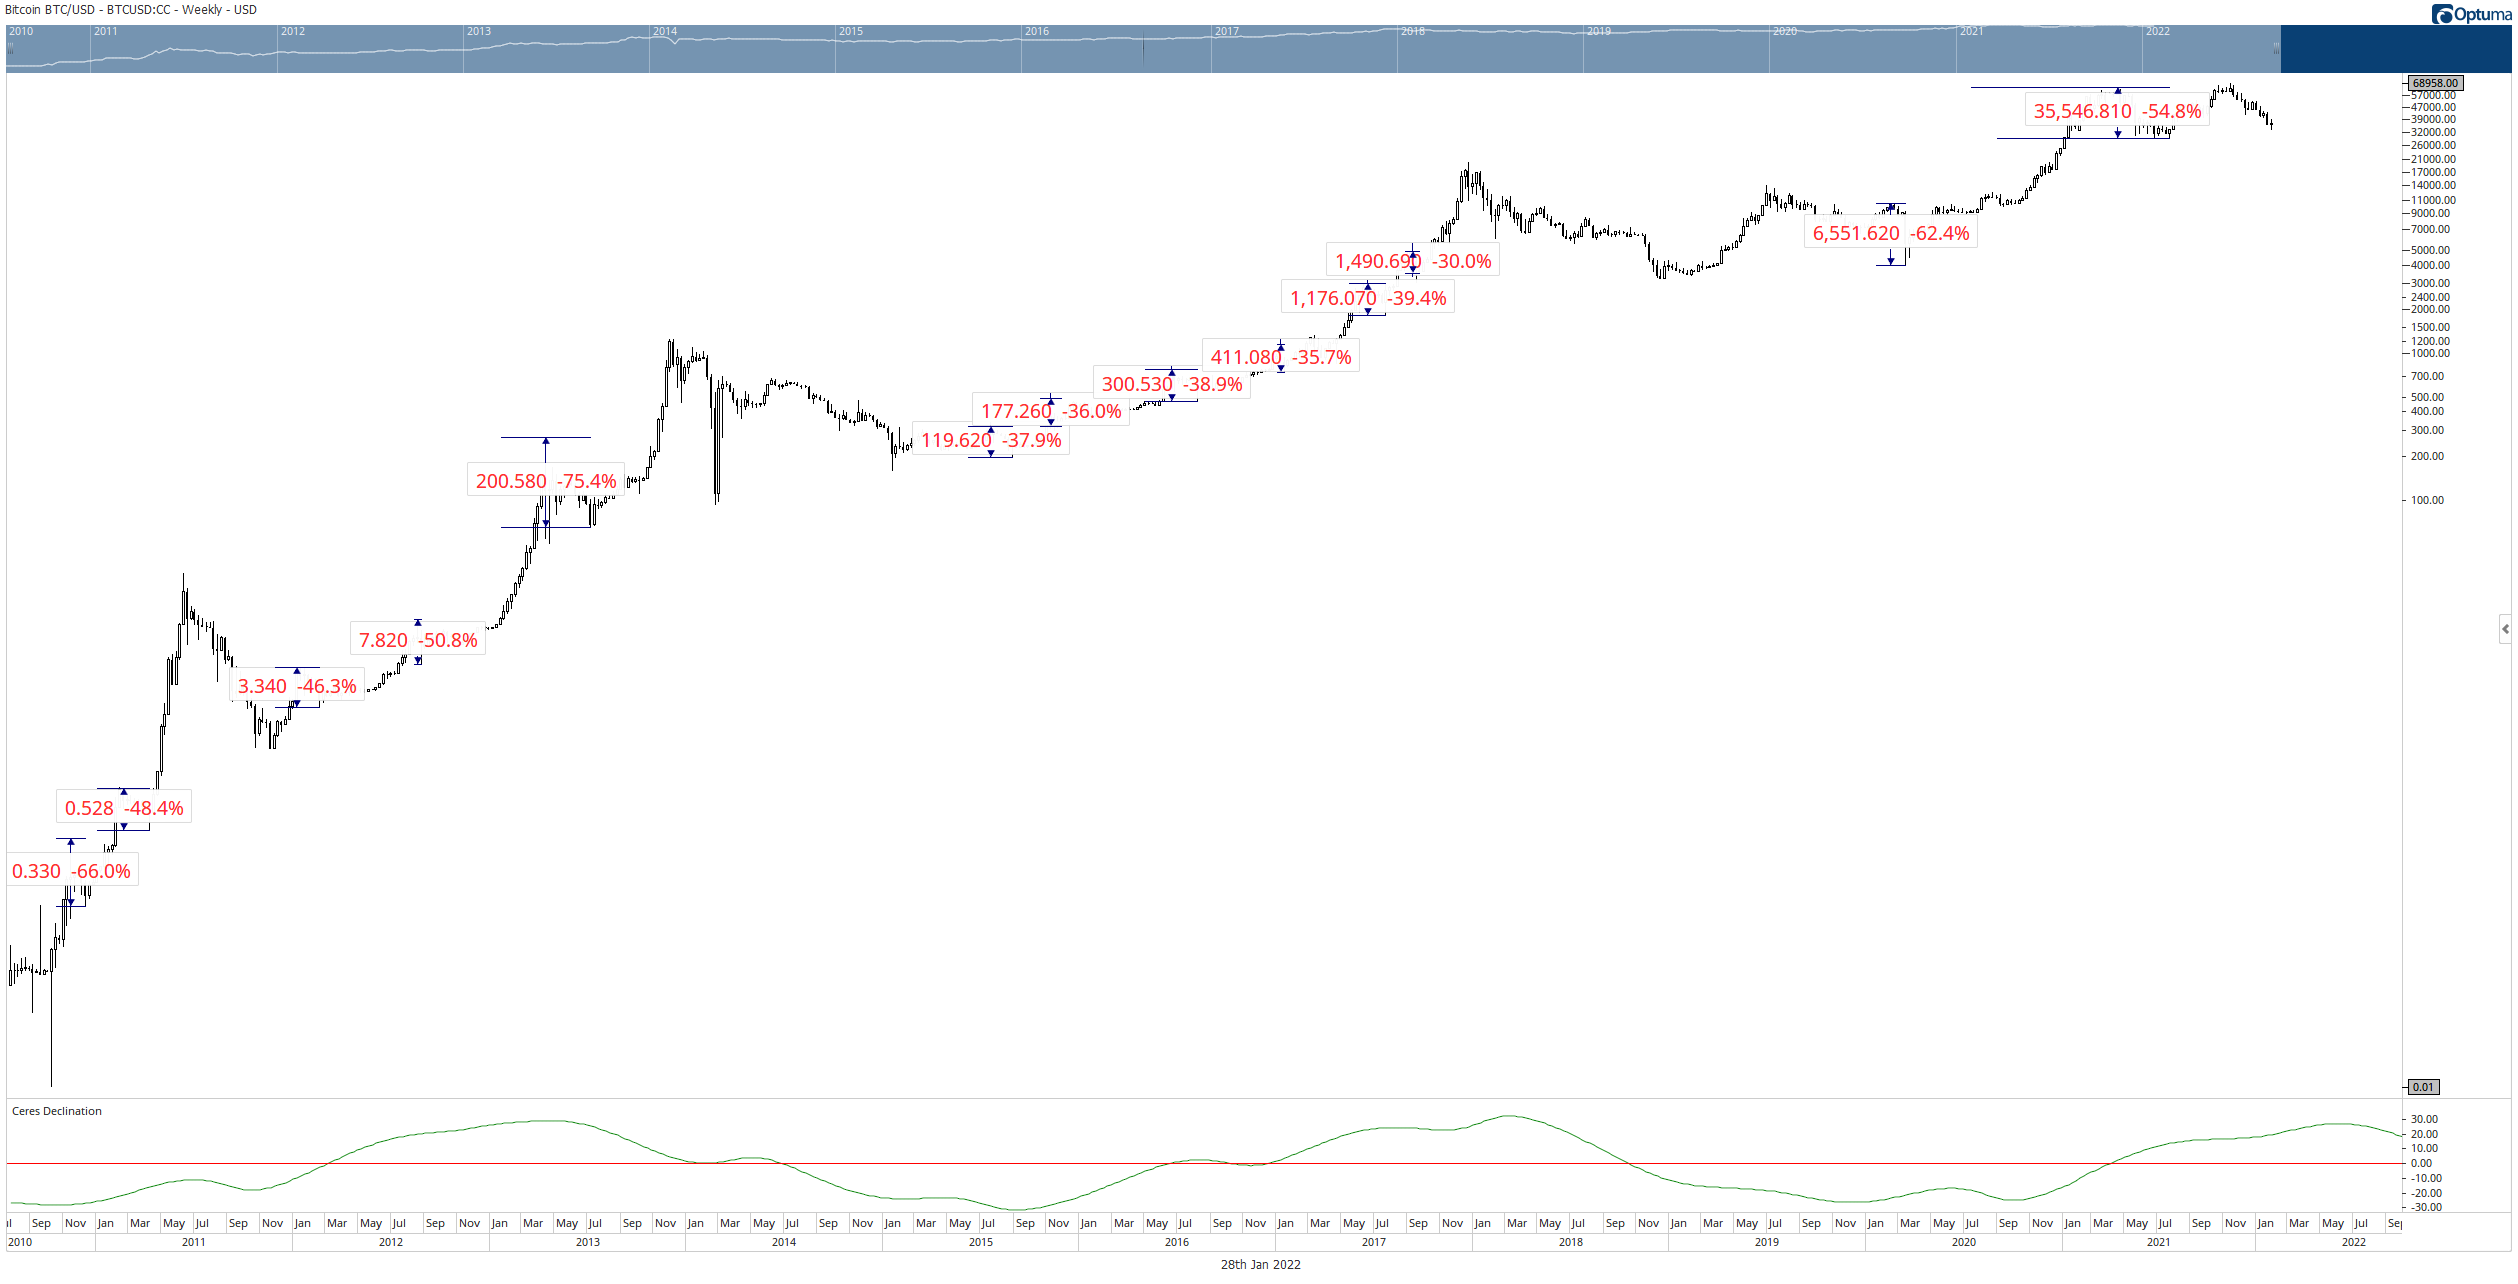
BTC/USD Weekly Chart
While the average pullback Bitcoin can experience can range between 30 – 40%, flash-crashes and short, sharp corrective moves over 50% occur, albeit rarely. So how is a bear market measured in cryptocurrencies when retracements are so sharp and volatile? The answer is time and sentiment.
Is investor sentiment the same or worse than December 2018 or March 2020?
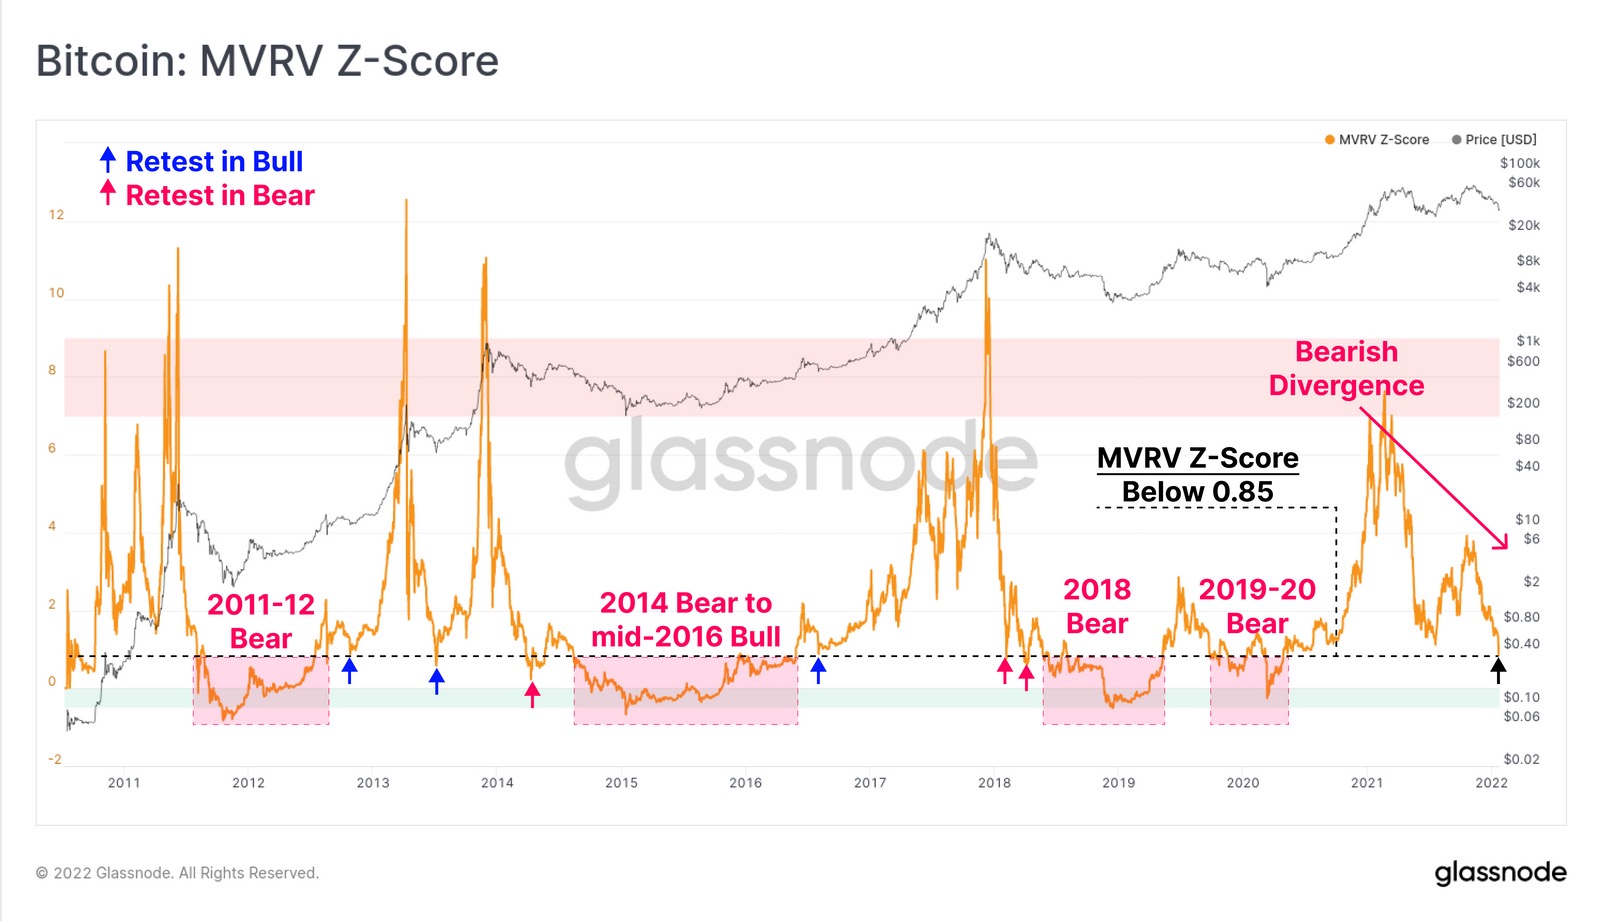
An excellent breakdown of Bitcoin’s current sentiment utilizing detailed on-chain metrics such as Realized-To-Liveliness (RTRO) and Market-Value-To-Realized-Value-Z-Scored (MVRV-Z) was recently completed by FXStreet’s Sarah Tran. On-chain metrics show many reasons to suggest that Bitcoin is either in a bear market or could begin one soon.
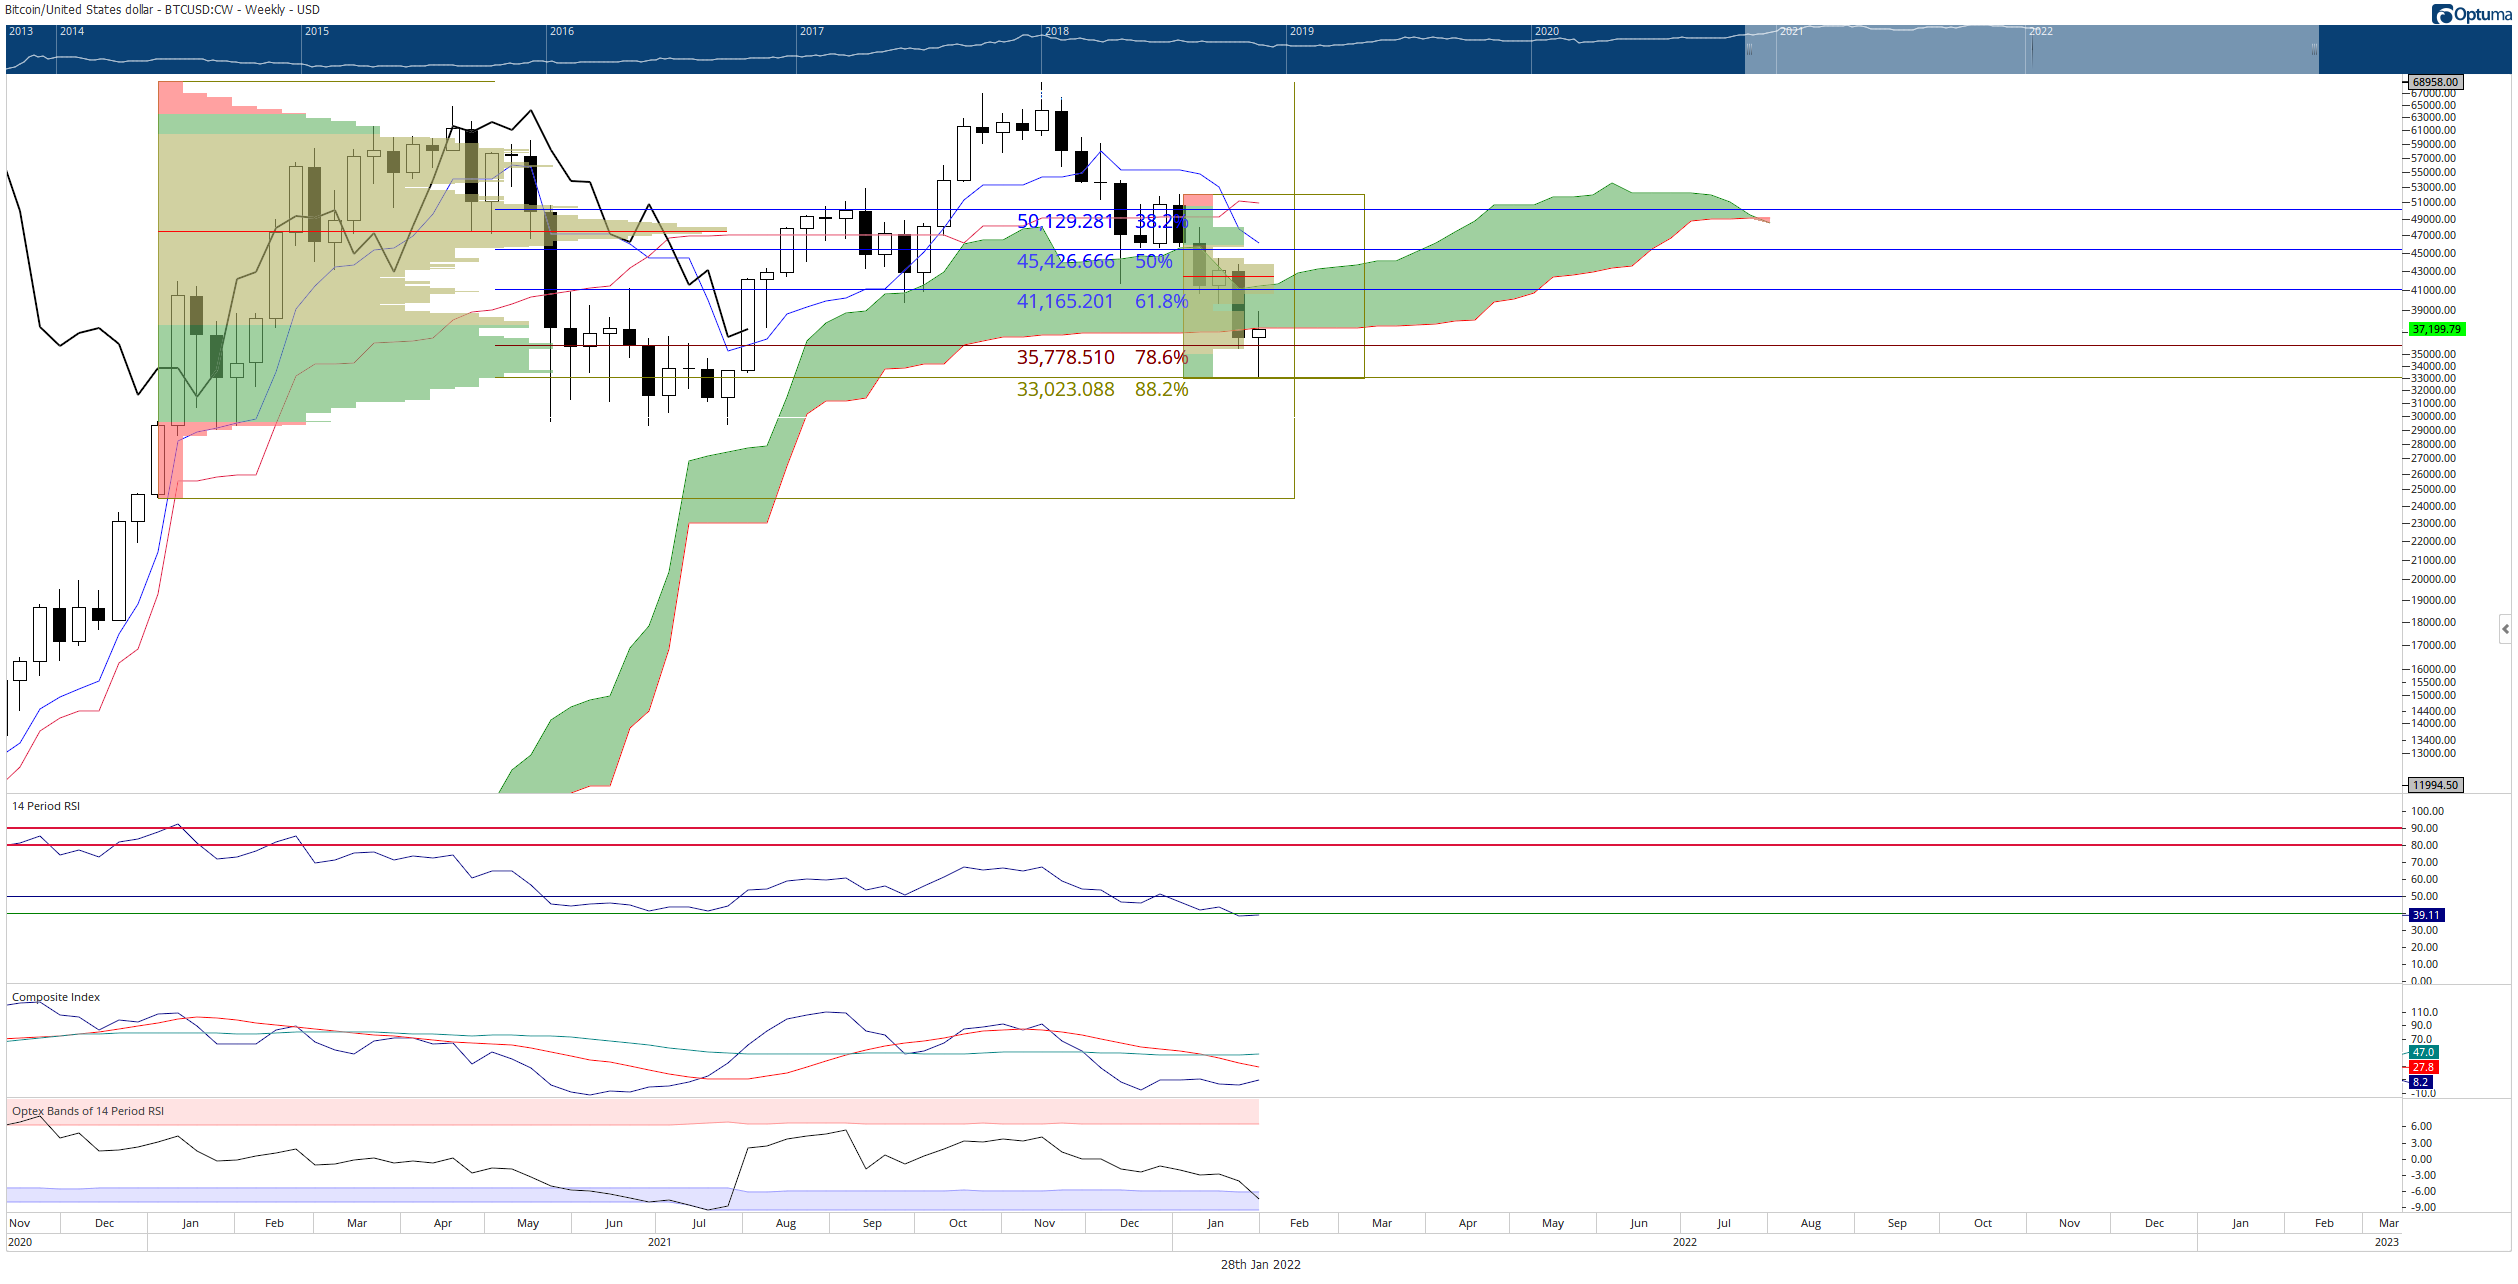
From a technical analysis perspective, Bitcoin’s oscillators on the weekly chart certainly help to confirm the negative sentiment:
- The Optex Bands oscillator is now in severely oversold territory, a condition seen only three times, first in October 2018 and again as recently as July 2021. It is worth noting that the Optex Bands low in July 2021 preceded the rally from $31,000 to nearly $69,000.
- The Composite Index is trading at the same level as the December 2018 – January 2019 lows, the September 2015 lows, and June – July 2021 lows.
- The Relative Strength Index has moved to lows not seen since the Covid-crash lows in March 2020 and January – February 2019.
From a price action perspective, the negative sentiment can also be measured. Bitcoin has fallen below the Ichimoku Cloud and threatens to close below the weekly Cloud for the first time since the Covid-crash in March 2020.
BTC/USD Weekly Ichimoku Kinko Hyo Chart
Additionally, a Spike Pattern is present on Bitcoin’s $2,000/3-box reversal Point and Figure chart. If there was a visual that screamed ‘Oversold,’ – it would be the Spike Pattern now present on this Point and Figure chart.
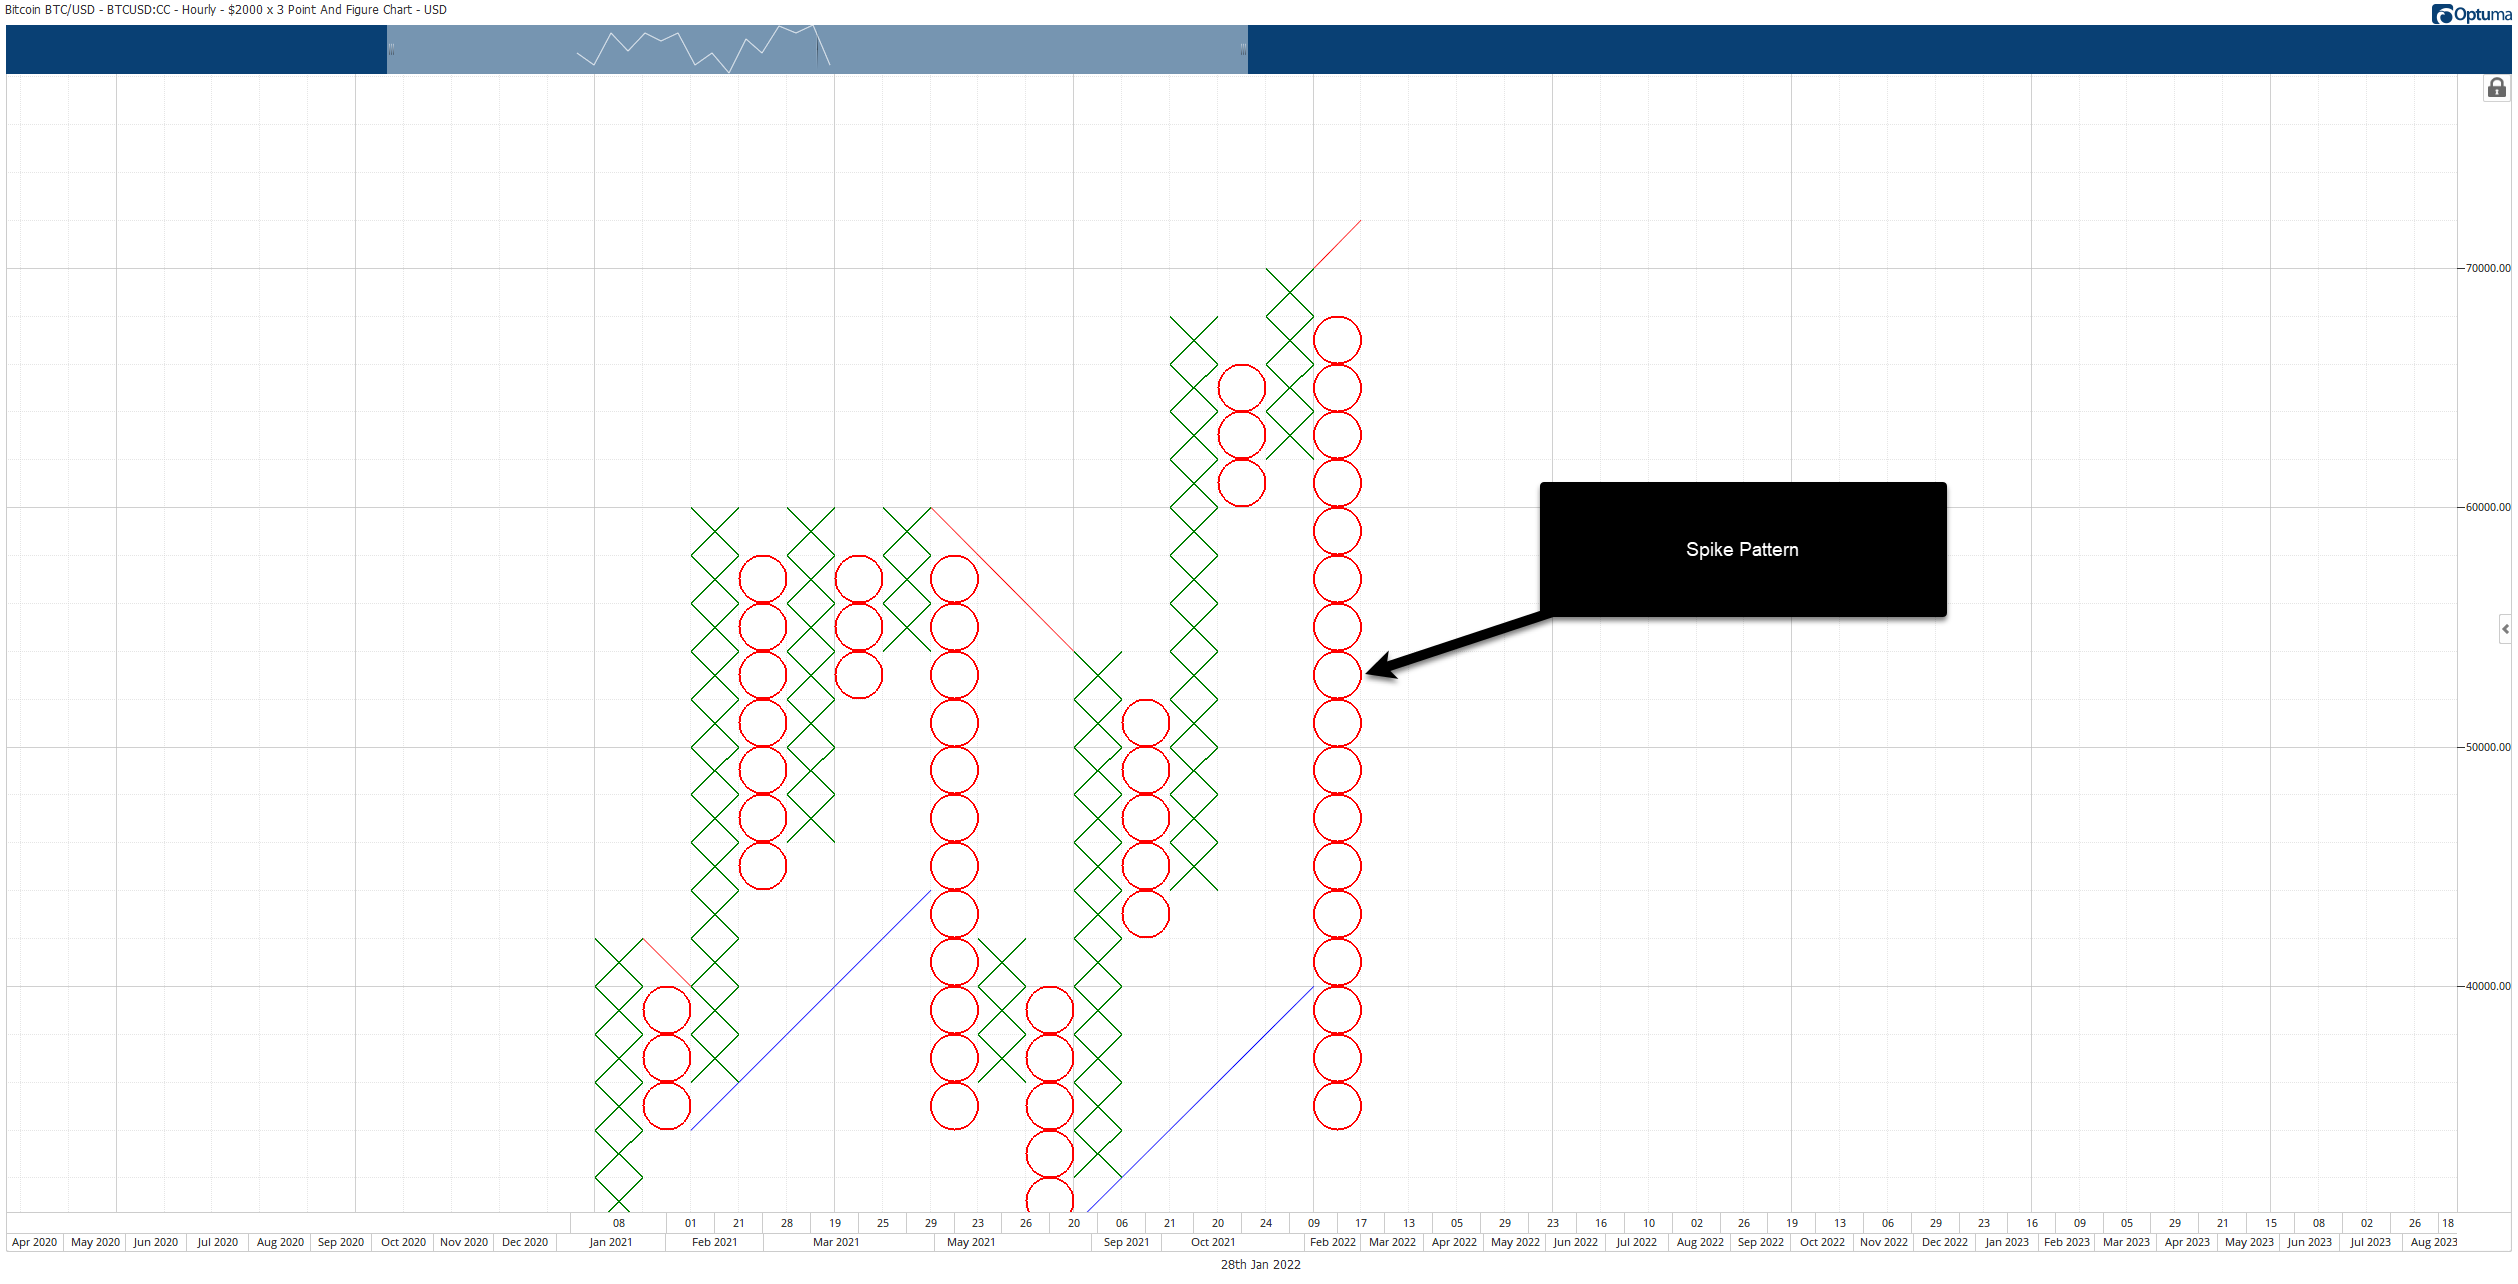
BTC/US $2,000/3-box Reversal Point and Figure Chart
A Spike Pattern is any column of fifteen or more Xs or Os. Spike Patterns are the definition of excess and extremely overdone price action. That means that Bitcoin has moved over $34,000 lower on this Point and Figure chart without a single reversal column appearing – that is an astounding bearish achievement and one for the history books.
Verdict: Bitcoin is not in a bear market – yet
With Bitcoin’s on-chain, fundamental, and technical analysis metrics pointing to extremes, which direction will Bitcoin move? Much will be dependent on how Bitcoin price closes the weekly candlestick. If it closes below the weekly Ichimoku Cloud, a flash-crash toward the $25,000 value area is in play.
However, a bullish reversal is highly probable because of how oversold and extended the market already is. If an upcoming rally does occur, it will be the critical test of whether Bitcoin is in a bear market or not. A return to test the $48,000 to $50,000 shows early signs of developing.
If bulls cannot sustain a move above the $48,000 - $50,000 price range in the near future, then the market will most certainly be primed for a genuine and extended bear market.
If Bitcoin has a weekly candlestick close below the weekly Cloud, then the probability of a move to test $48,000 - $50,000 becomes increasingly complex - perhaps temporarily insurmountable - as new all-time lows will print across Bitcoin’s oscillators, creating a sort of ‘price discovery’ mode of their own.
But in the interim, not the Federal Reserve, Federal Reserve Chairman Powell, or President Biden are likely to have any meaningful halt on Bitcoin’s broader uptrend and growth.
Author

Jonathan Morgan
Independent Analyst
Jonathan has been working as an Independent future, forex, and cryptocurrency trader and analyst for 8 years. He also has been writing for the past 5 years.