Top 3 Price Prediction Bitcoin, Ethereum, Ripple: XRP readies for 40% rally, as the crypto market consolidates
- Bitcoin price continues to coil within a symmetrical triangle, with the pattern apex converging on June 10.
- Ethereum price closed May with a long-legged doji pattern signaling equilibrium between the forces of supply and demand.
- XRP price forming cup-with-high-handle base, the first high probability opportunity for investors.

Bitcoin price coiling within a symmetrical triangle, but the risk is rising that the pattern fails to resolve. Ethereum price remains below the 50-day simple moving average (SMA), but on-chain metrics improve. XRP price trying to establish support again over $1.00, putting it on a course for a sustainable advance.
Bitcoin price needs a price thrust very soon, or it risks drifting away
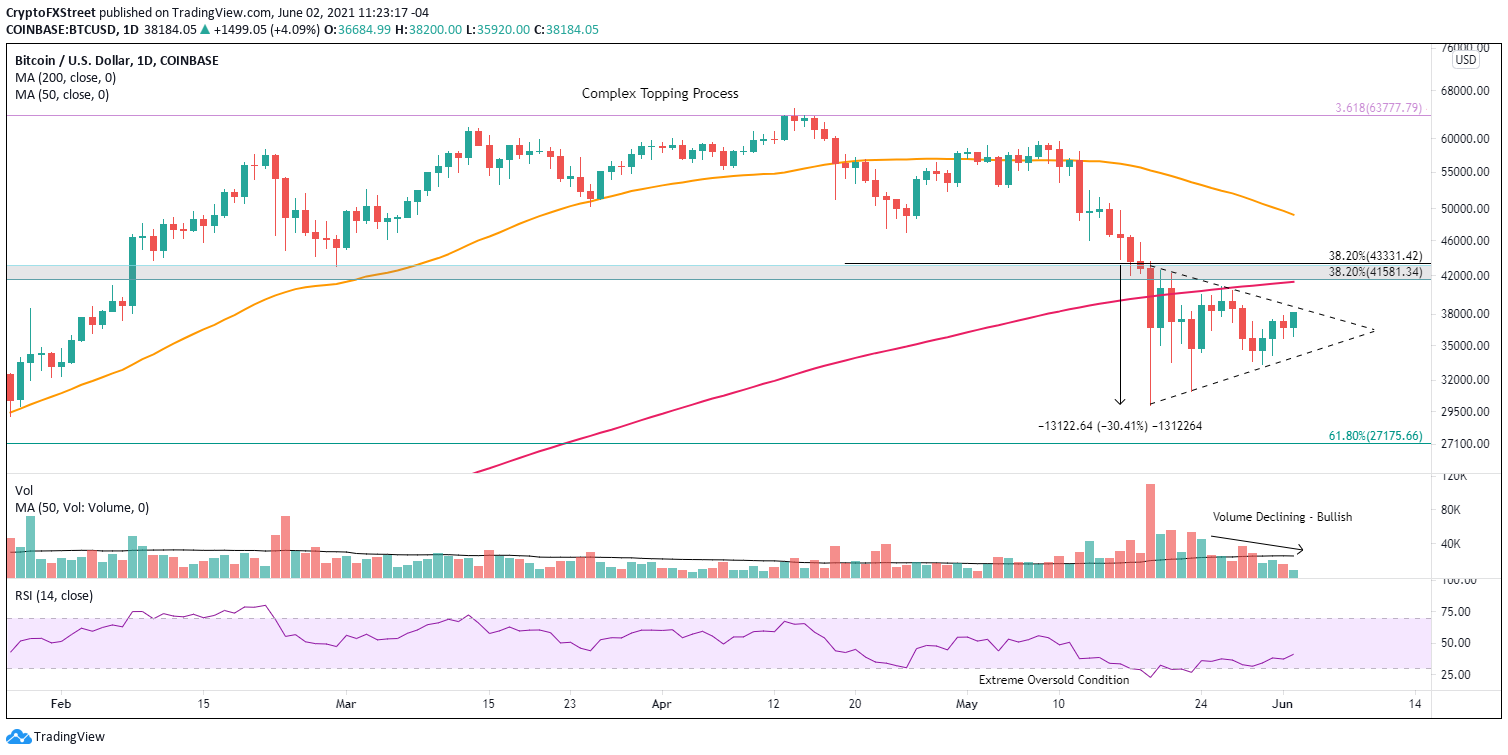
Bitcoin price has been defining a symmetrical triangle since May 19, with price now covering around 75% of the triangle, but it is becoming a problem for the eager bulls. The farther out into the triangle’s apex prices push without bursting its trend lines, the less thrust for the pattern. Instead of augmenting the power, it begins to lose its efficacy at a certain point.
Based on historical precedent, the best price thrusts arise when the price is between half and three-quarters of the horizontal distance from the base to the apex. Beyond three-quarters, prices usually extend to the apex and often result in a price drift, affording no clear projection for the future.
Bitcoin price has reached a critical moment in the construction of the symmetrical triangle formation. It is at the maximum distance from the apex for a hefty price thrust, but any more consolidation leaves the formation vulnerable to simple exhaustion.
The BTC symmetrical triangle lies below the intersection of multiple levels of resistance that will challenge Bitcoin price for days and possibly weeks to come if the triangle resolves to the upside. The resistance includes the 38.2% Fibonacci retracement of the historic rally from the March 2020 low to the April high at $41,581, the January 8 high at $41,986, the February 28 low at $43,016 and 38.2% retracement level of the April-May decline at $43,331.
The measured move of the BTC triangle is approximately 30%, creating an upside target of $50,325 from the current position of the triangle’s upper trend line, which coincides closely with the 50-day SMA at $49,248. To effect a rally to the measured move target, Bitcoin price needs to overcome the sizeable resistance mentioned above and the 200-day SMA at $41,363.
BTC/USD daily chart
If the pattern resolves to the downside, the target is $23,649 from the current position of the triangle’s lower trend line. Bitcoin price would overwhelm the May 19 low at $30,000 and the 61.8% retracement of the advance beginning in March 2020 at $27,175.
It is essential to mention that the downside BTC target is just above the 2017 high at $19,891.
Ethereum price supported by improving on-chain metrics
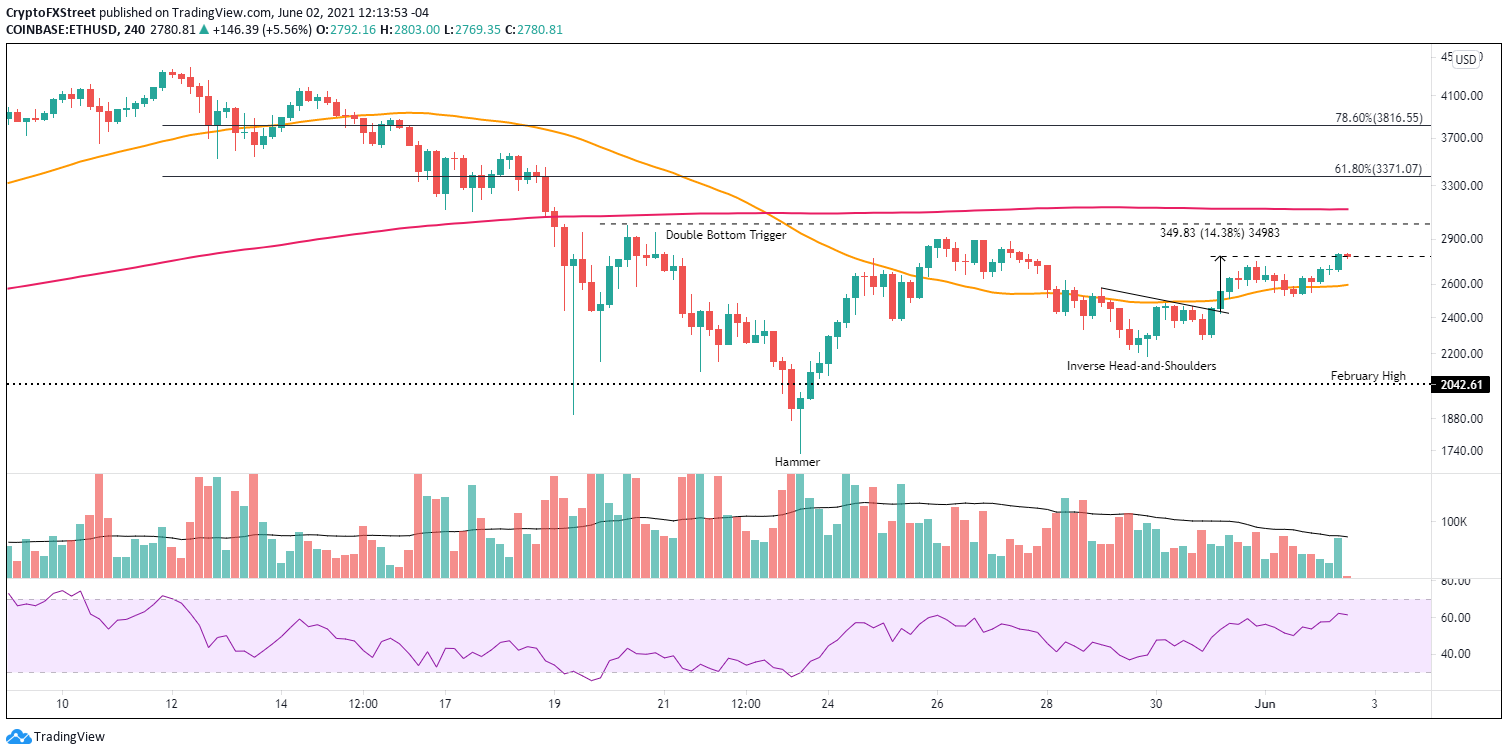
A bullish hammer candlestick on the 12-hour ETH chart initiated the rebound on May 23 after printing an oversold reading on the daily Relative Strength Index (RSI). It was accompanied by above-average volume. Moreover, the May 23 undercut of the May 19 low has established a double bottom pattern with a trigger price of $3,000.
Ethereum price is logging a 6% gain at the time of writing, building on a breakout from a minor inverse head-and-shoulders pattern on the four-hour chart. The measured move is around 14% from the neckline. ETH just reached the measured move target of $2,781.
If the rally continues to gain price traction, Ethereum price will engage resistance at $2,900 and then the double bottom trigger at $3,000. A push beyond the double bottom trigger will quickly identify resistance at the 200 four-hour moving average at $3,116. After the key moving average is the 61.8% Fibonacci retracement of the May correction at $3,369.
ETH/USD 4-hour chart
A daily close below $2,527 would downgrade the outlook for Ethereum price and raise the probability that ETH will sell down to the low of the right shoulder at $2,275.
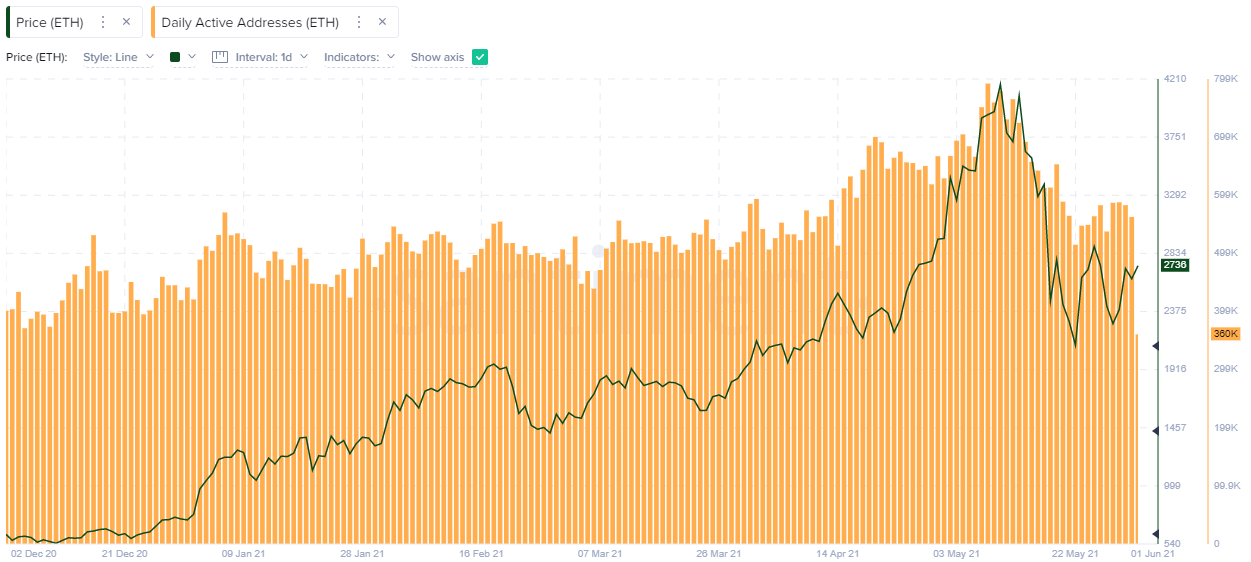
From May 8 until May 22, the number of active addresses involved in ETH transactions fell from 791.71k to 514.67k, representing a decline of 35%. The metric indicates the daily level of crowd interaction (speculation) with Ethereum.
The metric has modestly rebounded since May 22, suggesting that investors are returning to the digital asset. The rebound has been more robust than Bitcoin.
ETH Daily Active Addresses - Santiment
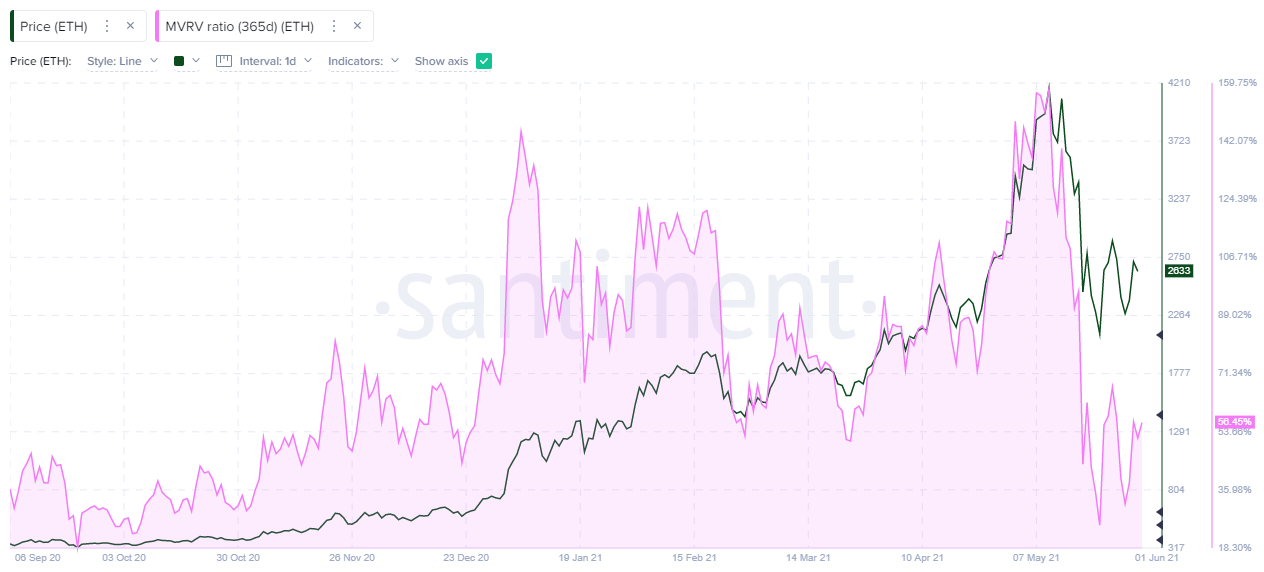
The Santiment Market Value / Realized Value (MVRV) metric measures when a market is undervalued or overvalued. Negative values indicate that the market is undervalued, offering a potential buying opportunity, while positive values indicate that the market is overvalued and vulnerable to selling.
The 365-day MVRV did not reach negative levels during the May correction, illustrating that there remain more profits to be harvested by long-term holders. However, when viewed in the context of the larger advance, the MVRV reached the lowest level since October 2020. Overall, the metric does show there is room for more ETH price appreciation moving forward.
ETH 365-day MVRV - Santiment
With MVRV relatively low and active addresses growing, Ethereum price builds the foundation for this minor uptrend to advance significantly.
XRP price forms base, but on-chain metrics remain hesitant
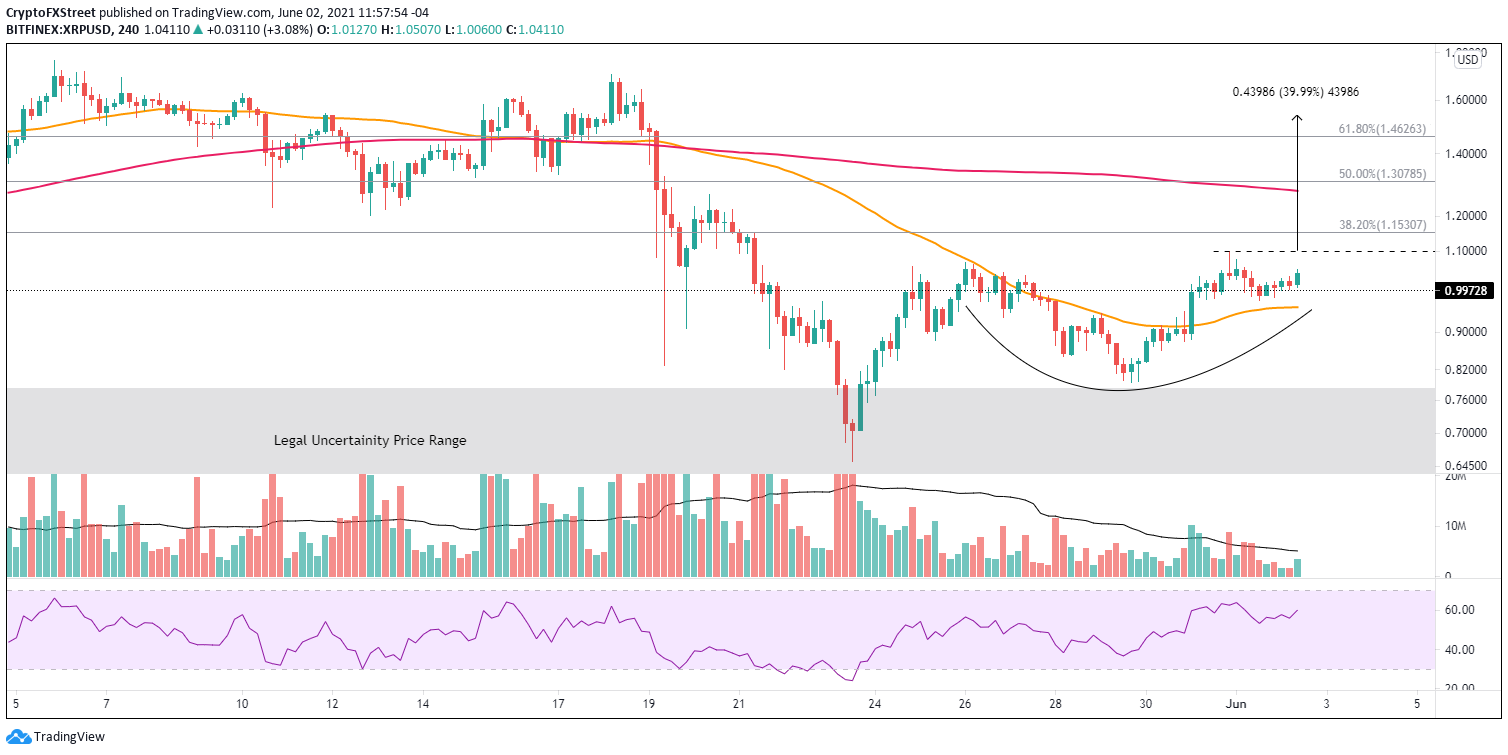
XRP price illustrates a cup-with-high-handle base on the four-chart, with a measured move target of $1.539, yielding a 40% return from the handle high at $1.10. The development of the pattern has been consistent with historical precedent, defined by rising volume on the right side of the cup and then progressively lower volume as the handle progresses. As for timing, the base could resolve in the next couple of days.
In the path of the measured move target is the 38.2% Fibonacci retracement of the April-May decline at $1.153. The declining 200 four-hour SMA at $1.27 will be a challenge, followed by the 50% retracement at $1.307 and the 61.8% retracement at $1.462.
XRP/USD 4-hour chart
The outlook is altered if XRP price closes below the 50 four-hour SMA at $0.957. It could signal another test of the $0.800-$0.850 price range that has been constructive support against heavy selling since the May 19 low.
Despite starting the week with an explosive 15% gain, some of Ripple’s on-chain metrics are languishing behind XRP price.
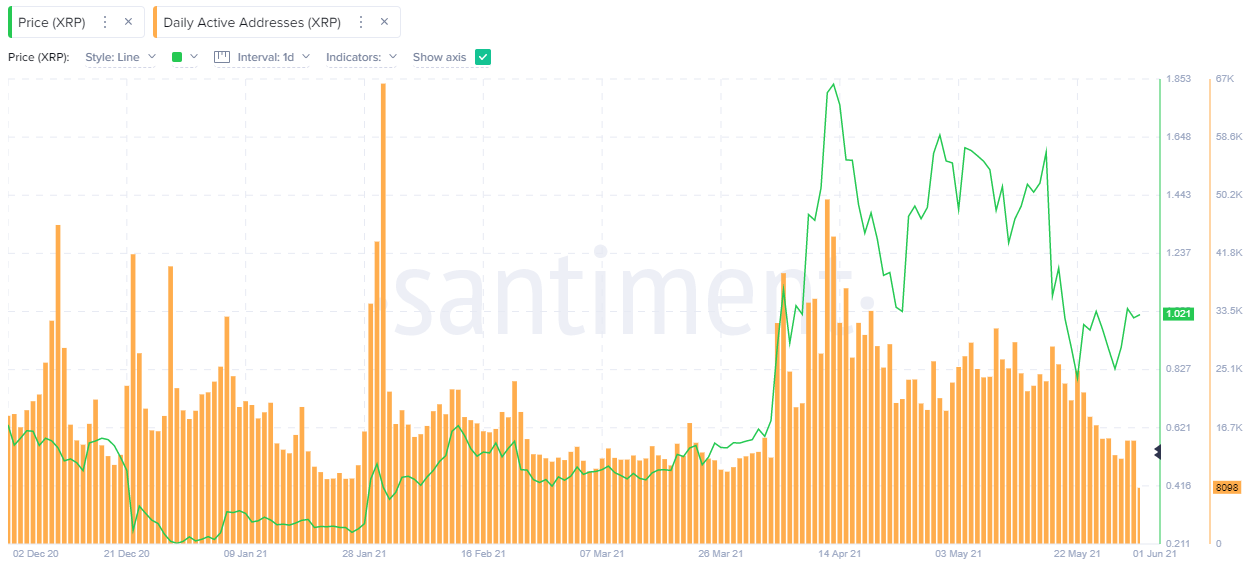
Yesterday, Ripple’s daily active addresses (DAA) dropped to 8,098, an 83% decline from the April 12 peak of 49,657. Moreover, it is the lowest level since the beginning of December 2020, revealing a notable shrinkage in daily interaction with the token. As the chart below highlights, previous rallies were usually supported by high address activity.
XRP Daily Addresses - Santiment
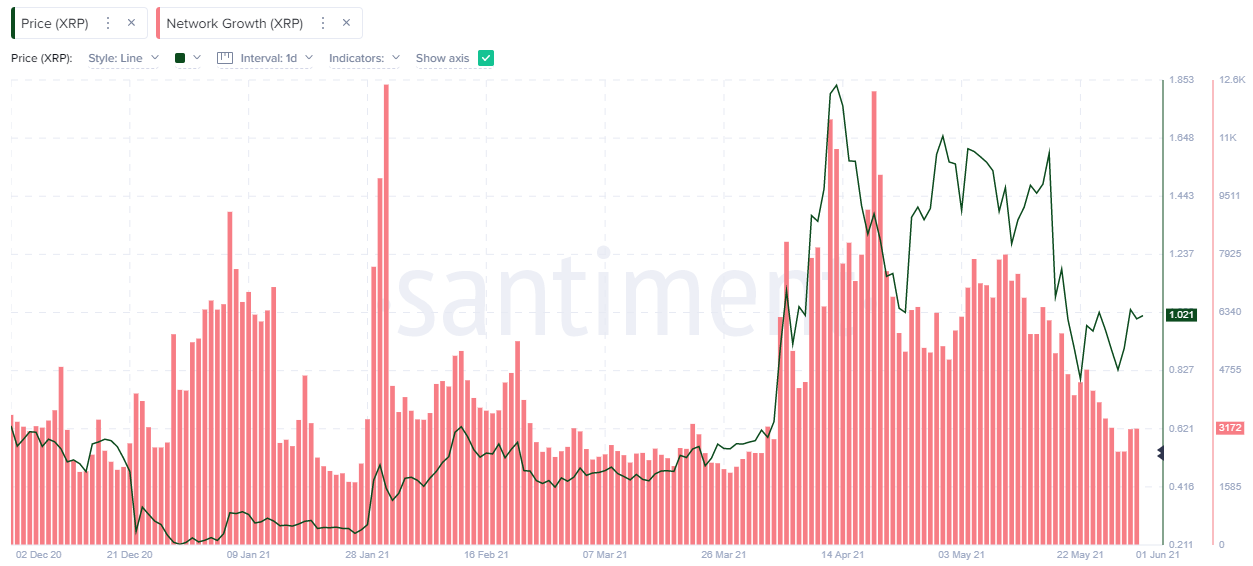
A similar message is being written by Ripple’s Network Growth (NG). The number of new addresses interacting with the coin daily has declined from 12,373 on April 19 to 3,172 as of May 31, representing a 73% decline. Additionally, the network growth has been on a steady decline since May 10.
The rebound in XRP price since the breakout from the minor inverse head-and-shoulders pattern, including a 15% gain on May 31, has not been matched by an uptick in Ripple’s network activity. It is an obstacle as XRP price tries to overcome the psychologically important $1.00 on a permanent basis.
XRP Network Growth - Santiment
Based on the two on-chain metrics, it is clear that XRP price strength has not been matched by an improvement in fundamental support. It can change quickly, mainly if Ripple extracts itself from the dominant magnet effect of $1.00 and success in the SEC case continues.
Author

Sheldon McIntyre, CMT
Independent Analyst
Sheldon has 24 years of investment experience holding various positions in companies based in the United States and Chile. His core competencies include BRIC and G-10 equity markets, swing and position trading and technical analysis.



