Top 3 Price Prediction Bitcoin, Ethereum, Ripple: The final pitstop on the path to Crypto Season
- Bitcoin price continues to auction in a tight congestion zone, signaling a sharp move could come soon.
- Ethereum price lacks volume, which could suggest bulls are uninterested.
- XRP price rallies north, but a pullback to wipe out early bulls remains on the table.

The cryptocurrency market is in a congested state, which is likely to resolve in a sharp directional move in October. Key levels have been identified.
Bitcoin price looks dicey
Bitcoin price currently auctions at $20,035. The peer-to-peer digital currency currently coils within the 8-day exponential and 21-day simple moving averages. This compression between two indicators signals a sharp move is coming to resolve the sideways price action.
There has been a significant uptick in volume this week. Binance exchange has reported the largest uptick in transactions in the last five years. The uptick comes at an interesting time in the macroeconomic environment regarding foreign currency inflation. During September, the Great British Pound and Japanese Yen witnessed extreme devaluing. Holders of said currencies may be contributing to the influx in volume, trying to recoup their losses and gain new yield.
A spike up towards $20,900 is highly probable, but there are significant resistance levels near the $21,000 zone. Additionally, a spike to wipe out the summer lows at $17,592 is less than 10% away from Bitcoin’s current market value. That being said, this thesis remains neutral until a directional trend is propelled from coiling moving averages. The earliest confirmation is a daily New York session close above or below the indicators.
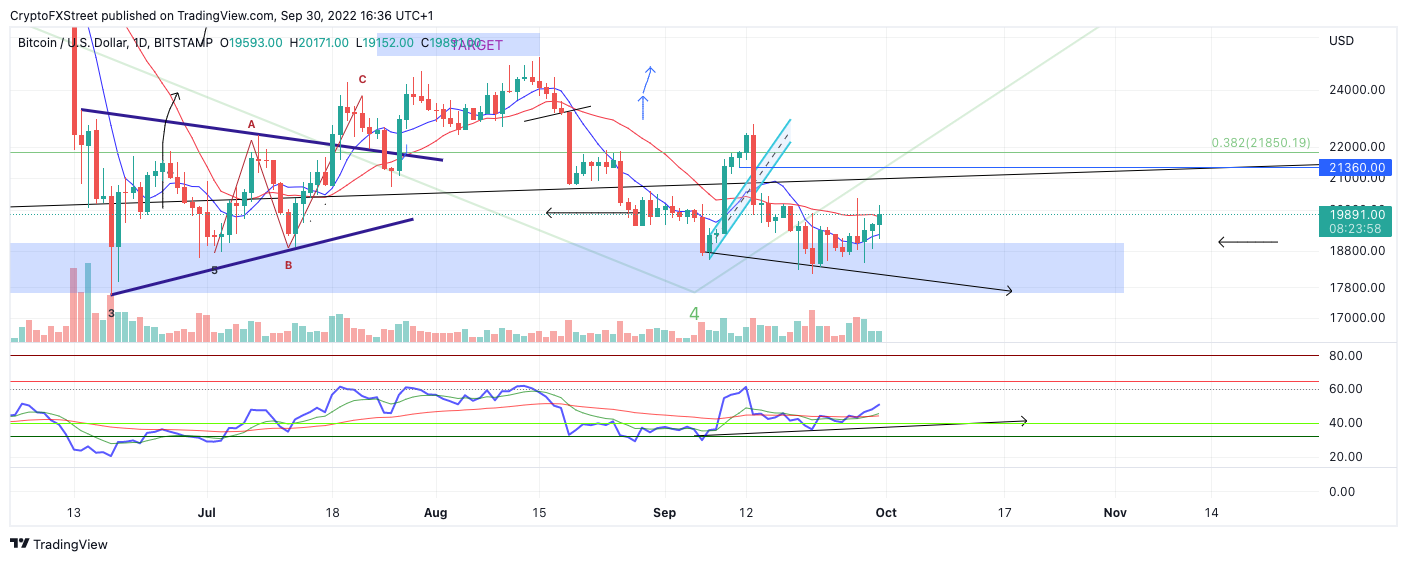
BTC USD 1-Day Chart
In the following video, our analysts deep dive into the price action of Bitcoin, analyzing key levels of interest in the market. -FXStreet Team
Ethereum price shows weakness
Ethereum price currently auctions at $1,338. The bulls have struggled to gain support from the 8-day EMA all week. Unlike Bitcoin price action, the volume amidst the current sell-off is relatively sparse. Although this is an optimistic signal that the downtrend is weakening, sometimes markets can roll over simply from a lack of buying interest.
The lack of retaliation from the bulls could be evidence of a true downtrend underway. The Relative Strength Index shows a bullish divergence on higher time frames, but ETH will need to start trending north to confirm whether the signal is valid.
Therefore, this thesis leans bearish, targeting the summer lows at $880. Invalidation of the bearish view is a definitive structure change above $1,600. If the bulls can flip this barrier as support, the Ethereum price could rally towards the September high at $2,030.
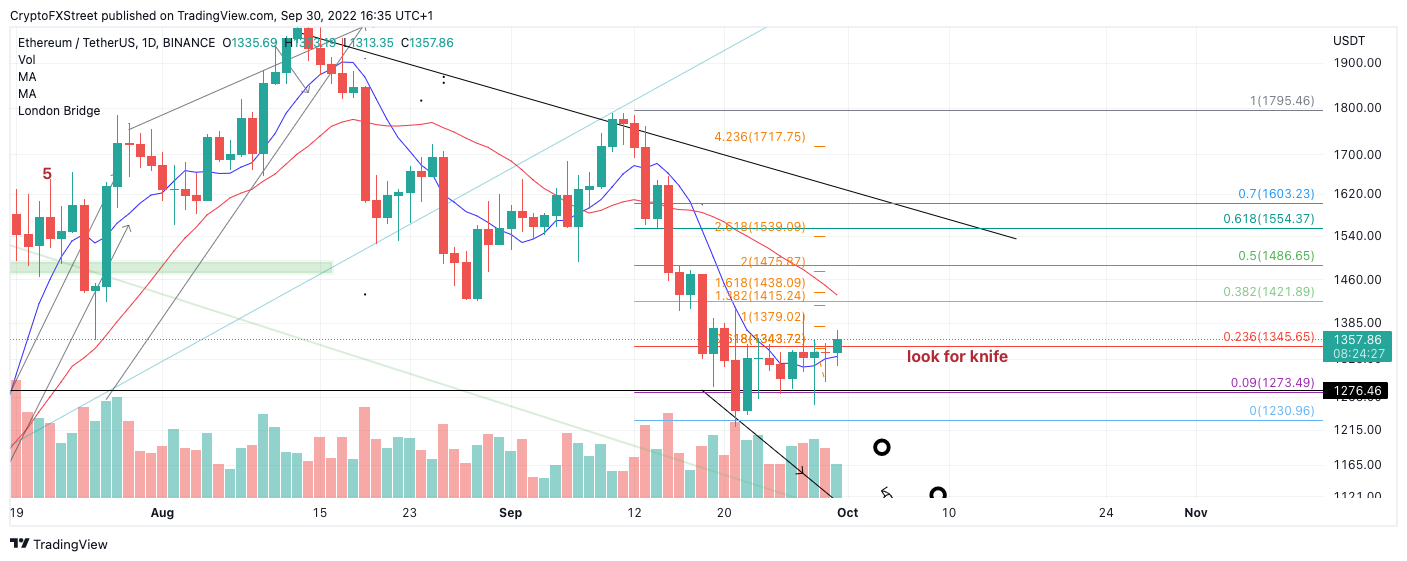
ETH USDT 1-Day Chart
In the following video, our analysts deep dive into the price action of Ethereum, analyzing key levels of interest in the market. -FXStreet Team
XRP price is bullish until proven otherwise
XRP price pulled off an impressive 20% rally on Thursday, September 29. The sharp increase in profit shows less volume than the previous 70% bull run. This subtle cue suggests XRP could be enticing retail traders to join the next rally prematurely in hopes of aiming for magnet-like confluence levels near $0.60.
XRP price currently auctions at $0.48 as the digital remittance token has increased its market value by 66% this month. A Fibonacci Retracement level surrounding the strongest rally during September shows the “golden pocket” 61.8% retracement level at $0.41. The level remains unvisited since the Ripple bull run broke new highs for September at $0.56. A plunge into that level remains plausible and would result in a 15% decline from the current market value.
The earliest evidence to confirm a bearish idea will be a breach at $0.45. If the bears tag $0.45, the bearish scenario is likely underway. If $0.45 remains untagged throughout the weekend, the bulls could rally towards $0.60, resulting in a 28% increase from the current XRP price.
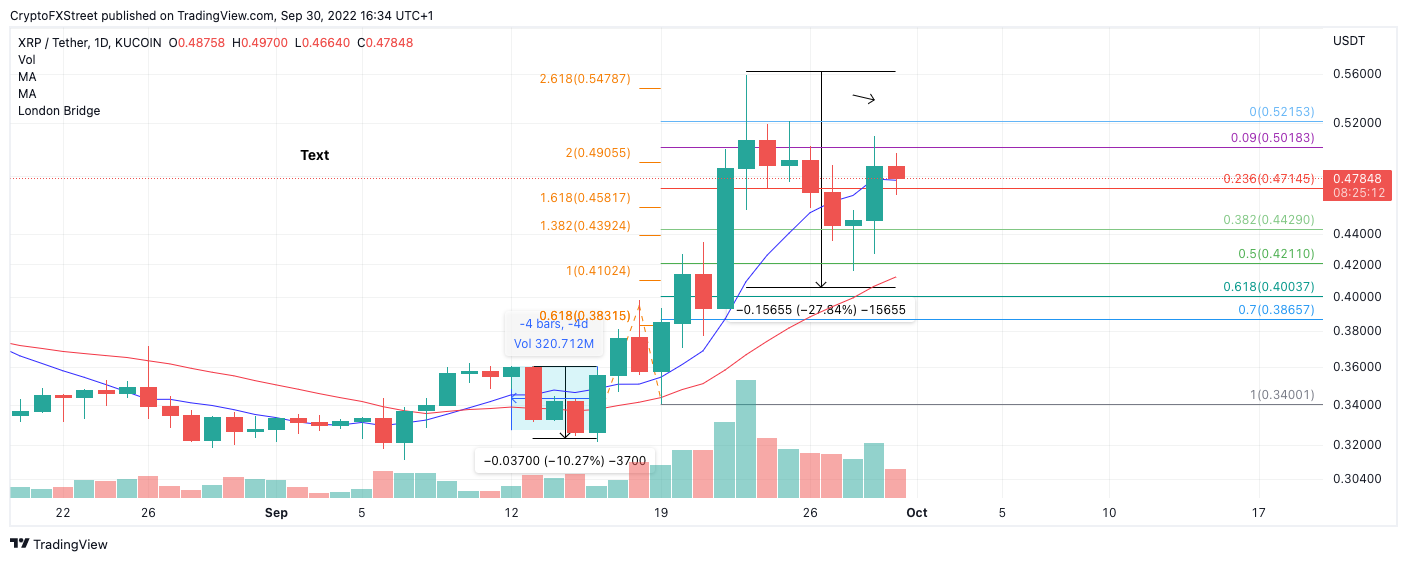
XRP USDT 1-Day Chart
In the following video, our analysts deep dive into the price action of Ripple, analyzing key levels of interest in the market. -FXStreet Team
Author

Tony M.
FXStreet Contributor
Tony Montpeirous began investing in cryptocurrencies in 2017. His trading style incorporates Elliot Wave, Auction Market Theory, Fibonacci and price action as the cornerstone of his technical analysis.


