Top 3 Price Prediction Bitcoin, Ethereum, Ripple: The crypto market holds above crucial support levels for now
- Bitcoin price is testing the neckline of an inverse head-and-shoulders pattern for the third time since March 16.
- Ethereum price is defending a significant support level on the 4-hour chart.
- Ripple price is forming a pennant on an intra-day basis.

Bitcoin and Ethereum dropped overnight as the Federal Reserve Chairman Powell offered a subdued take on cryptocurrencies at a conference yesterday. Adding to the weakness was a strong dollar and a drop in the 10-year treasury yield.
Bitcoin price bending, but not breaking
During March 22’s trading session, Bitcoin crashed below the lower trendline that dates back to March 16 and tested the head-and-shoulders bottom’s extended neckline at $54,620. It is the third test of this support level in the past week while registering the most oversold condition in over a month.
If the developing intra-day bounce gets traction, it will find resistance at the 100 SMA currently at $56,350, followed by the broken trendline, which coincides with the February high at $58,367. The 50 SMA has flipped lower, adding downward pressure on any rebound.
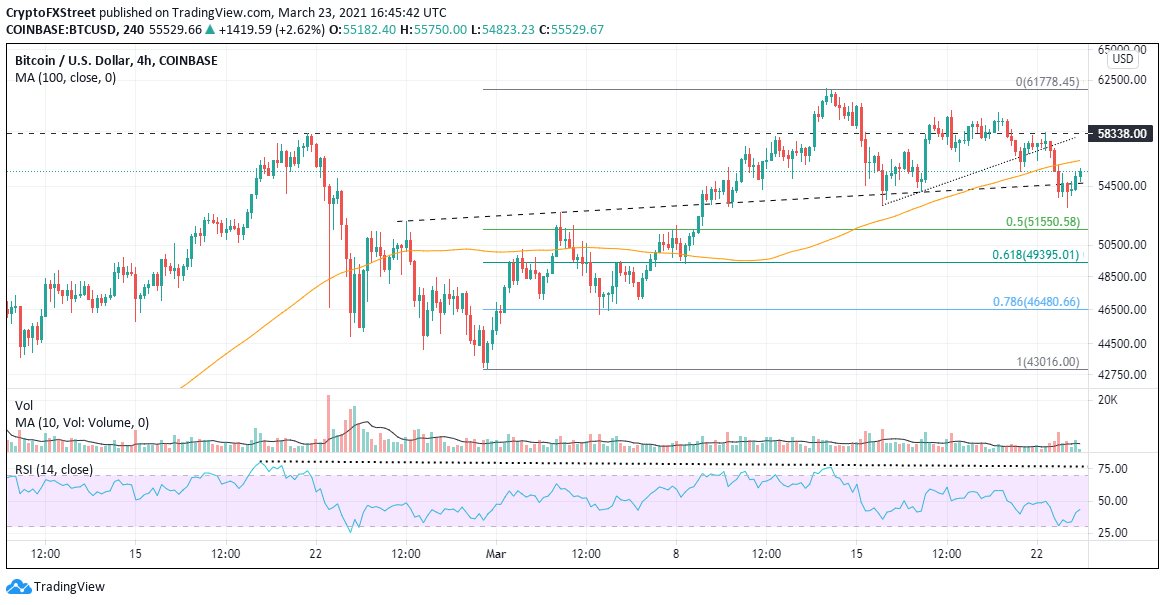
BTC/USD 4-hour chart
A close below March 23’s low at $53,000 on the 4-hour chart will prompt traders to wait for support at the 0.50 retracement level at $51,550. The next support materializes at the 0.618 Fibonacci retracement at $49,395.
Etherum price at a critical technical juncture
Like Bitcoin, Ethereum experienced a sharp decline on March 22 on a significant spike in volume compared to average volume. In fact, it was the highest volume on a 4-hour candlestick since February 25, generating the highest oversold reading since the February 23 crash low.
Ethereum found support at the intersection of the recent head-and-shoulders pattern and the 0.382 Fibonacci retracement level at $1,663. Despite the extreme oversold condition, the ongoing rebound has been corrective, not impulsive, indicating that traders are still not better buyers at these levels.
Considerable short-term resistance is at the 100 SMA at $1,793.32, followed by the right shoulder high at $1,869. A close above the right shoulder would confirm that the topping pattern has been voided.
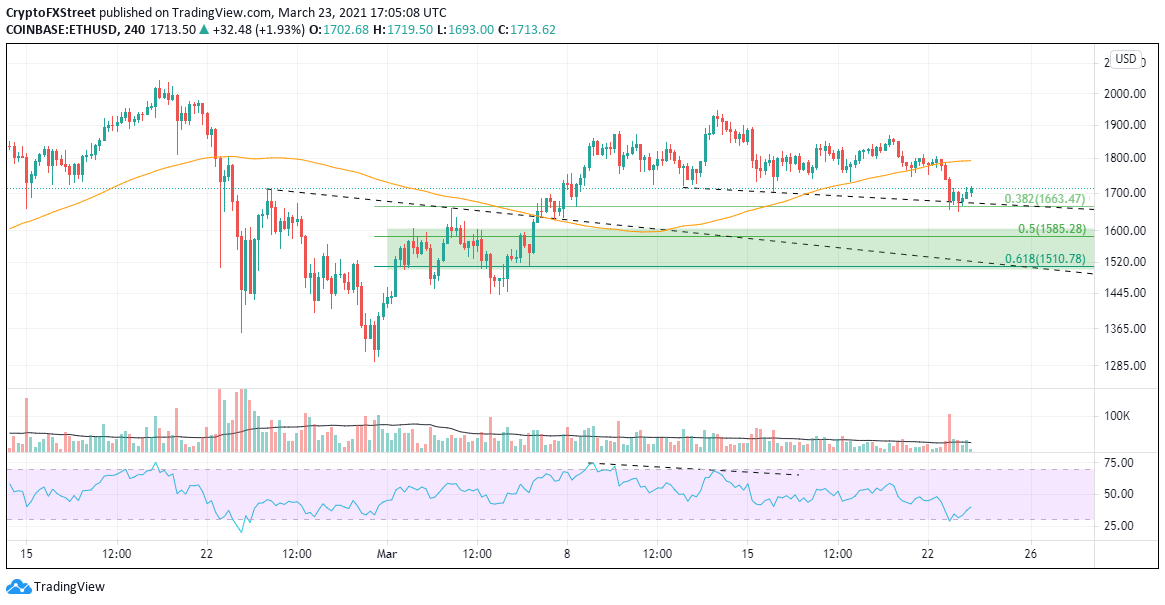
ETH/USD 4-hour chart
A continuation of the sell-off should find support between the 0.50 retracement level at $1,585.28 and the 0.618 Fibonacci retracement level at $1,510.78. The price levels match an area of price congestion associated with the right shoulder of the head-and-shoulders bottom in late February and early March.
Ripple price preparing for another impulsive candlestick
Since mid-March, XRP has incrementally nudged higher, with a few notable positive candlesticks dispersed throughout the advance. Ripple still has the overhang of the ongoing SEC investigation, and it should caution traders from diving into heavy long positions.
Still, XRP price is anticipating an eventual positive resolution. Remember, price is generally looking out 6-8 months.
From a technical perspective, Ripple continues to look higher in the short-term as it is currently shaping a pennant pattern on the 4-hour chart. It is finding support on the lower trendline, and volume has substantially contracted as the pattern has developed, indicating another big candlestick is around the corner.
The first upside target is marked by the February 22 high at $0.650 and the December 17, 2020 high at $0.656, representing a 13% gain from the pennant breakout. An additional upside target is the February 1 high at $0.757.
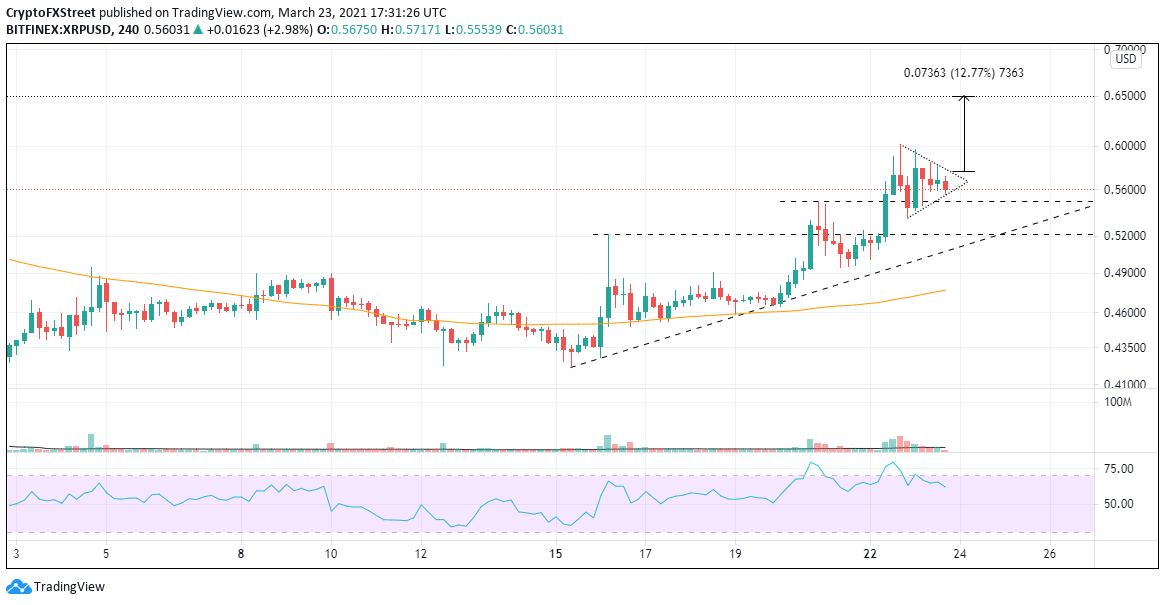
XRP/USD 4-hour chart
Downside targets begin with the March 20 reversal high at $0.549, followed by the reversal high on March 16 at $0.521. The last essential support is the rising trendline from the March 15 low at $0.507 before heavy selling would commence.
Author

Sheldon McIntyre, CMT
Independent Analyst
Sheldon has 24 years of investment experience holding various positions in companies based in the United States and Chile. His core competencies include BRIC and G-10 equity markets, swing and position trading and technical analysis.


