Pi Network Price Forecast: PI recovers ahead of the New Year
- Pi Network is up nearly 1%, extending a rebound from $0.20.
- A spike in social interest surrounding the Pi network reflects retail anticipation of a New Year rebound.
- The technical outlook for PI remains optimistic as it reverses from a key support.

Pi Network (PI) edges higher by almost 1% at press time on Wednesday, extending recovery after a Doji candle with 0.40% gains on the previous day. Data shows an increase in Pi Network’s social dominance, suggesting a boost in retail interest. The technical outlook for PI suggests a potential rebound from $0.20 amid a Morning Star pattern.
Social interest in Pi Network revives
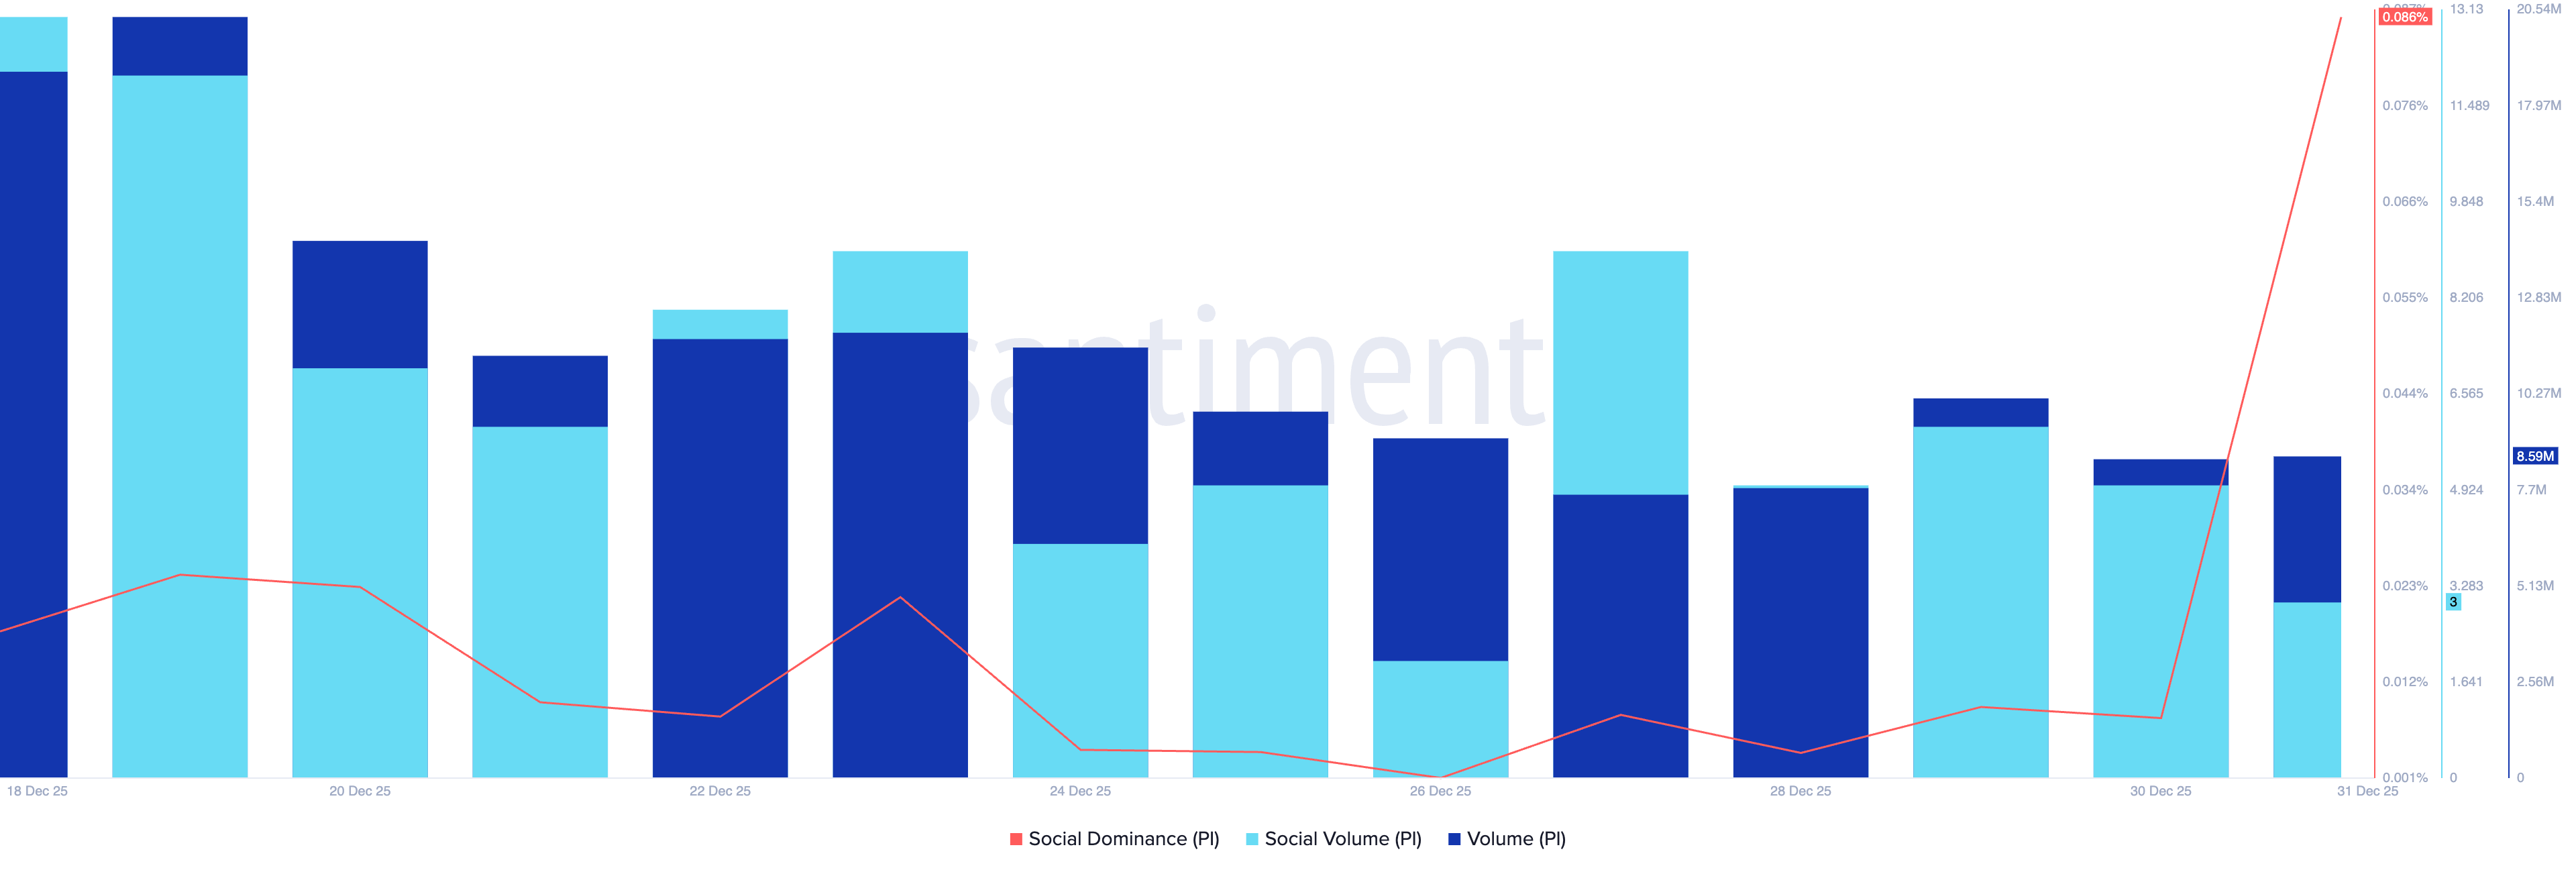
Santiment data shows that Pi Network's social dominance – which tracks the share of discussion about PI in the crypto media – stands at 0.086%, up from 0.008% the previous day. This indicates a boost in social buzz surrounding PI, potentially anticipating a New Year rebound.
Meanwhile, the daily trading volume has held above 7 million PI in December but has declined to 8.58 million PI on Wednesday, from 38.65 million PI on December 1.
Technical outlook: Will PI rebound from $0.20?
Pi Network continues to trade above $0.20 despite multiple failed rebound efforts. At the time of writing, PI is up nearly 1% on Wednesday, which prepares a potential Morning Star pattern, combined with a Doji candle on the previous day and Monday’s 1.17% decline.
A successful completion of this pattern could boost the PI token price toward the 50-day Exponential Moving Average (EMA) at $0.2191.
The momentum indicators on the daily chart remain mixed, with Pi fluctuating above $0.20. The Relative Strength Index (RSI) is at 41, pointing toward the halfway line, indicating neutral to bearish pressure.
At the same time, the Moving Average Convergence Divergence (MACD) indicator shows a steady rise in the average lines accompanied by rising green histogram bars, indicating a gradual surge in bullish momentum.
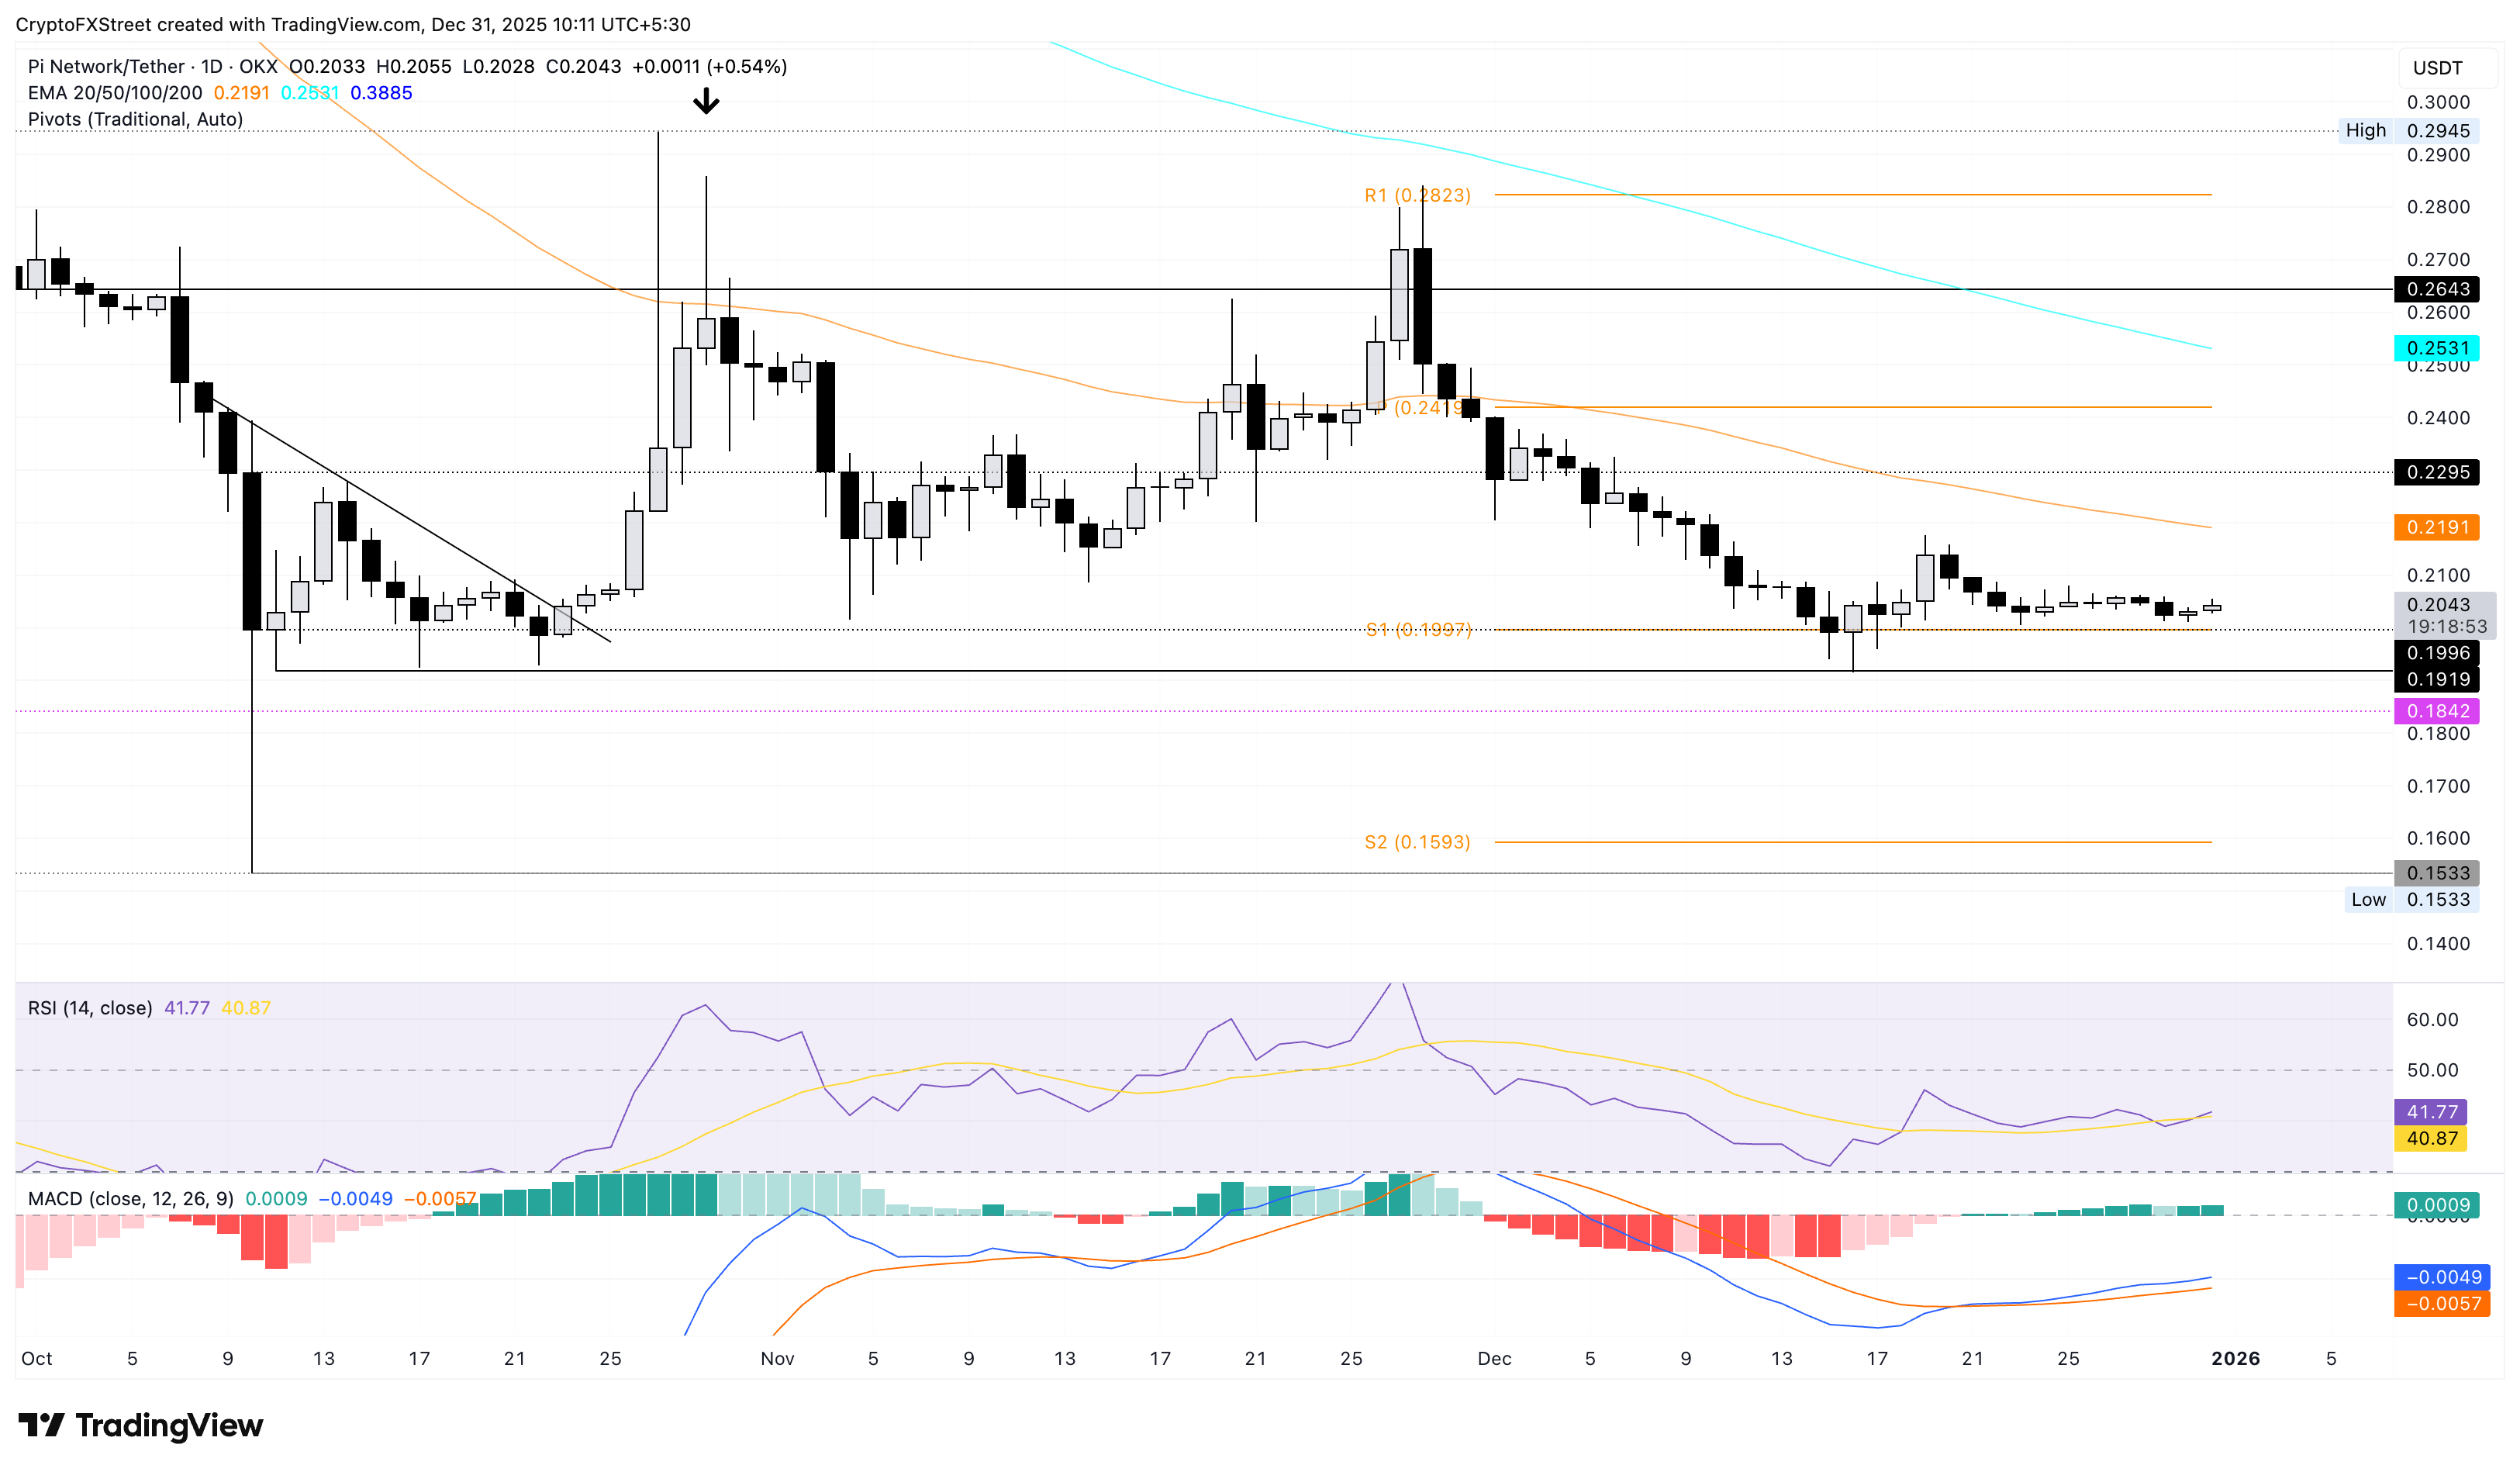
Looking down, if PI slips below the October 11 low of $0.1919, it could test the S2 Pivot Point at $0.1593.
Author

Vishal Dixit
FXStreet
Vishal Dixit holds a B.Sc. in Chemistry from Wilson College but found his true calling in the world of crypto.




