Top 3 Price Prediction Bitcoin, Ethereum, Ripple: Nightmares repeat as BTC flash crashes
- Bitcoin price slid roughly $7,000 on Wednesday after Elon Musk tweeted that Tesla will not accept BTC.
- Ethereum price dropped only $270 and is in recovery mode.
- Ripple eyes a dip into the demand zone ranging from $0.941 to $1.156 before it attempts to rise higher.

The recent Bitcoin price crash seen on Wednesday is comparable to the one in late April. However, unlike the last time, this drop was not due to rumors of new tax proposals. While many altcoins are recovering quickly, DeFi coins seem to be making a faster comeback.
Tesla drops plans of accepting BTC
The latest slump in the cryptocurrency market seems to be attributed to Tesla CEO Elon Musk’s tweet that revealed the electric vehicle manufacturer would not accept BTC.
Tesla & Bitcoin pic.twitter.com/YSswJmVZhP
— Elon Musk (@elonmusk) May 12, 2021
According to the tweet, Tesla's decision revolved around the heavy use of coal-powered electricity to mine Bitcoin and its negative impact on the environment.
Cryptocurrency is a good idea on many levels and we believe it has a promising future, but this cannot come at great cost to the environment.
However, the note did go on to summarize that “Tesla will not be selling any Bitcoin.”
The energy consumed to mine BTC has been a decade-long debate despite primarily using renewable energy sources or electricity that otherwise would have gone to waste. According to Dan Held, growth lead at Kraken:
PoW (proof-of-work) is the buyer of last resort for all electricity, creating a floor that incentivizes the building of new energy producing plants around disparate energy sources that would have otherwise been left untapped.
While Musk’s tweet might be conveying Tesla’s opinions, his personal opinions seem to be further from the fact as he tweeted “True” to a tweet from Twitter’s Jack Dorsey, which emphasized how Bitcoin mining incentivizes renewable energy.
Regardless of the opposing views, Bitcoin investors seemed to have panic-sold their holdings, causing a 20% crash.
Bitcoin price creates a new quarterly low
After dropping nearly $9,000, Bitcoin price created a new low for the second quarter at $46,000. As recovery efforts seem to be ongoing, BTC faces pressure from the range low set up on April 18.
For now, Bitcoin price remains indecisive. However, a convincing close above the resistance level at $53,300 will confirm an uptrend. On the other hand, a rejection will kick-start a downtrend that could reenter the demand zone extending from $46,930 to $49,949.
Assuming a bullish scenario, Bitcoin price would primarily consolidate after clearing $53,300. This move would be similar to the one witnessed after the initial crash on April 18 or the recovery after April 26.
A swift upswing that slices through $55,813 will open up the possibility of retesting $57,526 and subsequent levels.
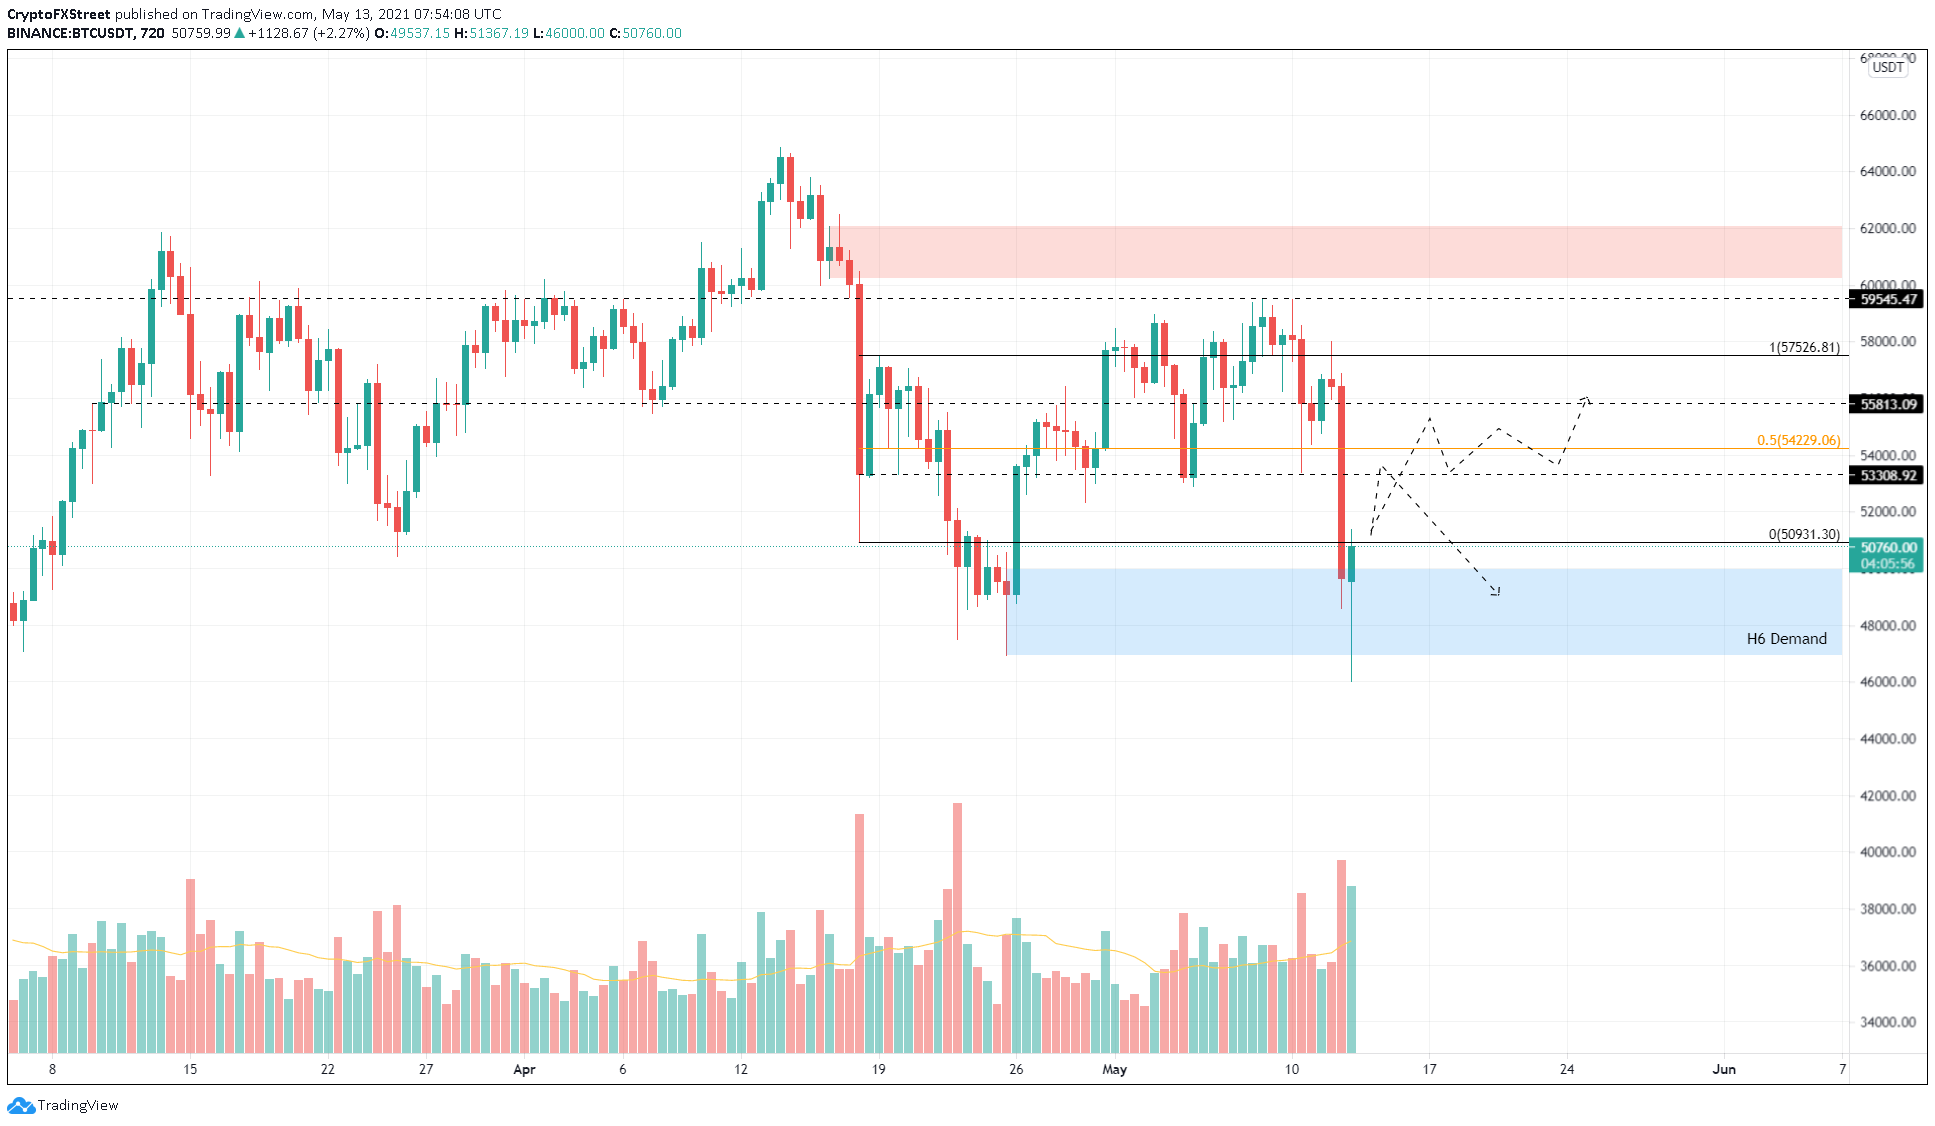
BTC/USDT 12-hour chart
On the flip side, if the sellers overwhelm the buyers around $53,300, a 6% downswing will allow the bears to retest the said demand zone. A breakdown of $46,930 will push Bitcoin price to the recent swing low at $46,000, followed by another 6% drop to $43,000.
Ethereum price finds a foothold
Ethereum price recovered nearly 14% from the crash’s lowest point, which coincided with the 50 four-hour Simple Moving Average (SMA) at $3,788. Although this bounce has allowed ETH bulls to climb higher, only a decisive close above this level would promote an upswing to the next supply level at $4,179.
If the buyers manage to maintain their momentum here or even add to it, a 5% upswing will push Ethereum price back to its all-time high at $4,380.
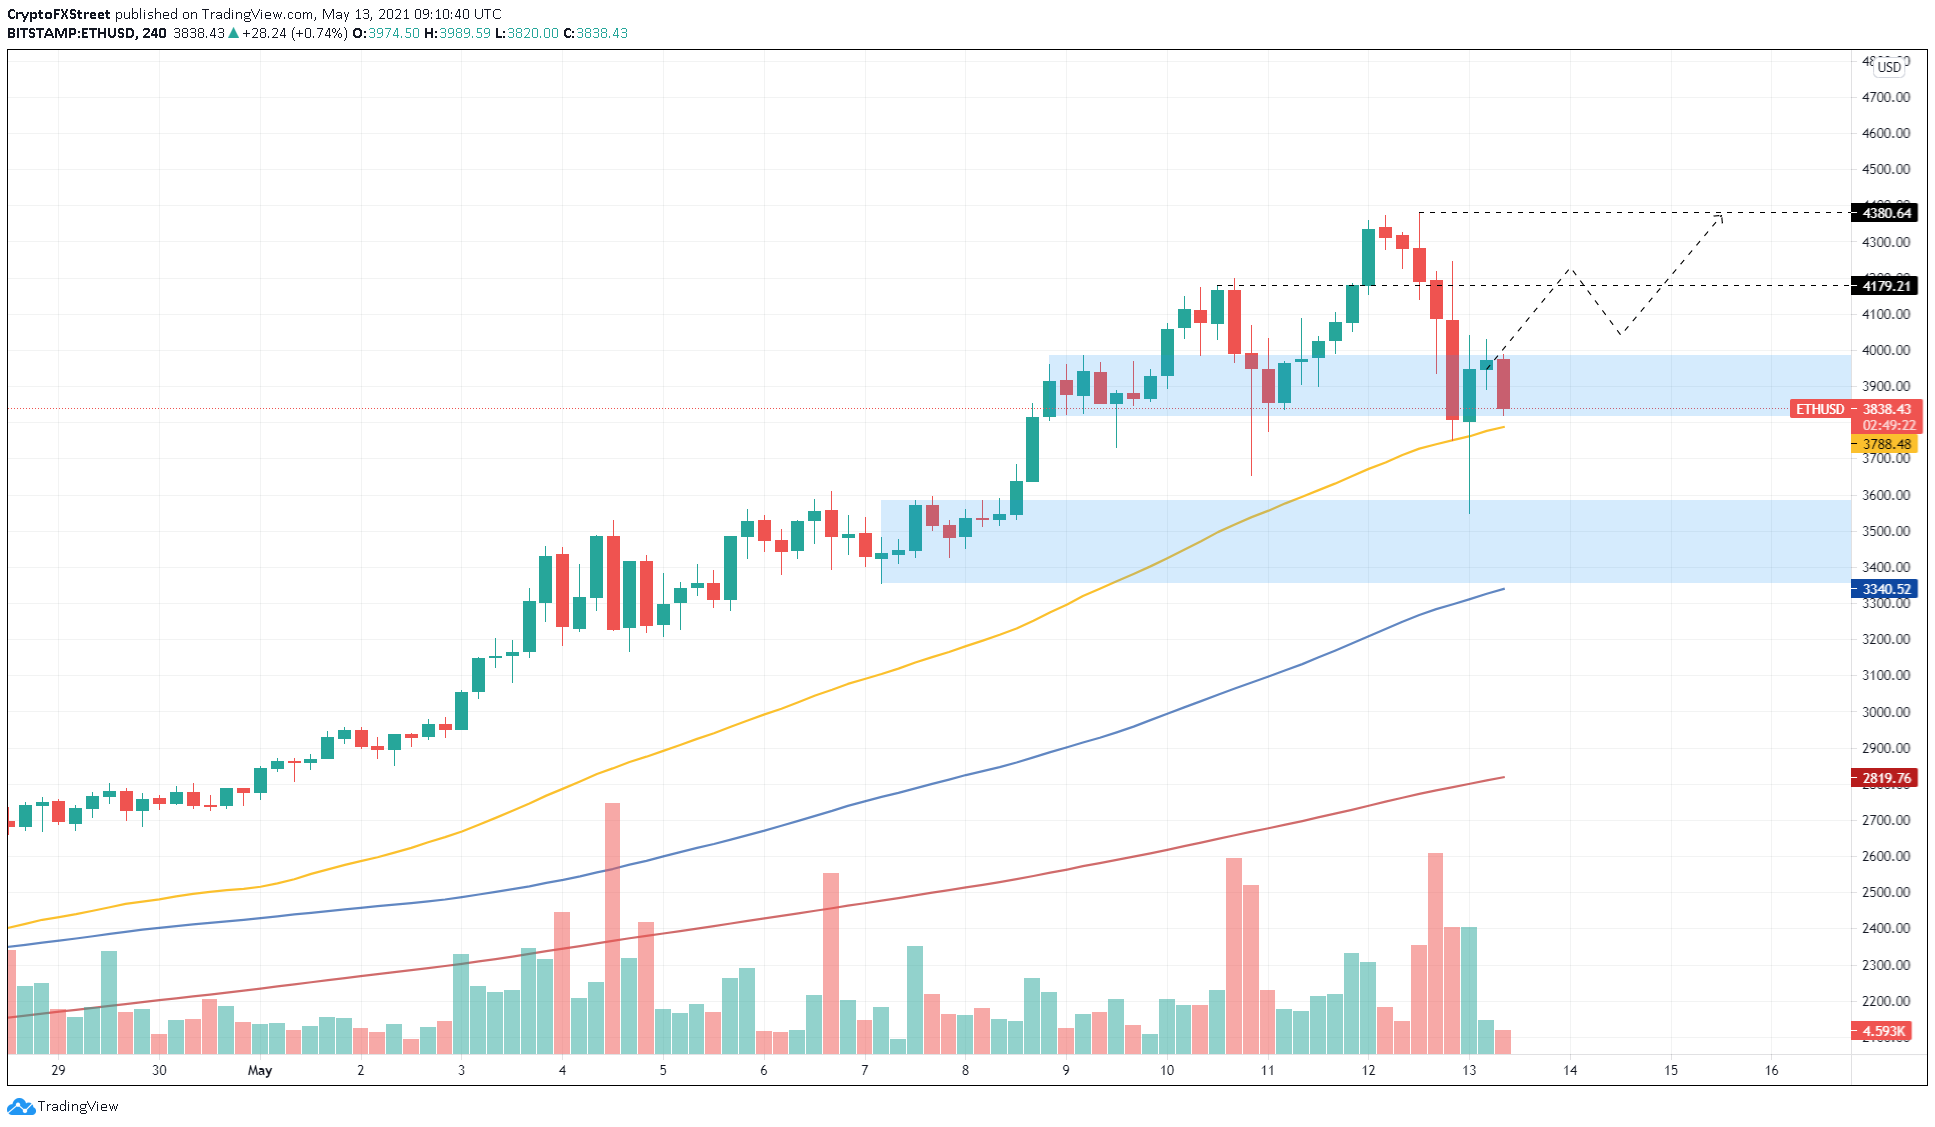
ETH/USD 4-hour chart
However, a failure to stay above the 50 SMA will spell trouble for the altcoin pioneer, triggering a 6% sell-off to the immediate demand barrier that ranges from $3,355 to $3,584. The lower range of this zone coincides with the 100 SMA. Therefore, a breakdown of this will invalidate the upswing for Ethereum price.
Ripple struggles to surge as resistance levels multiply
Ripple price slid 22% as it bottomed around $1.20. However, buyers quickly scooped up XRP, which pushed the remittance token to tag the lower boundary of the demand zone that ranges from $1.372 to $1.477.
A reduced buying momentum has led to a pullback that seems to be heading toward the subsequent demand barrier that stretches from $0.941 to $1.156. Although Ripple has set up lower highs and lower lows since May 4, the bulls can kick-start an upswing from the demand zone mentioned earlier.
In that case, the areas of interest as XRP price surges higher include $1.465, $1.653 and $1.769.
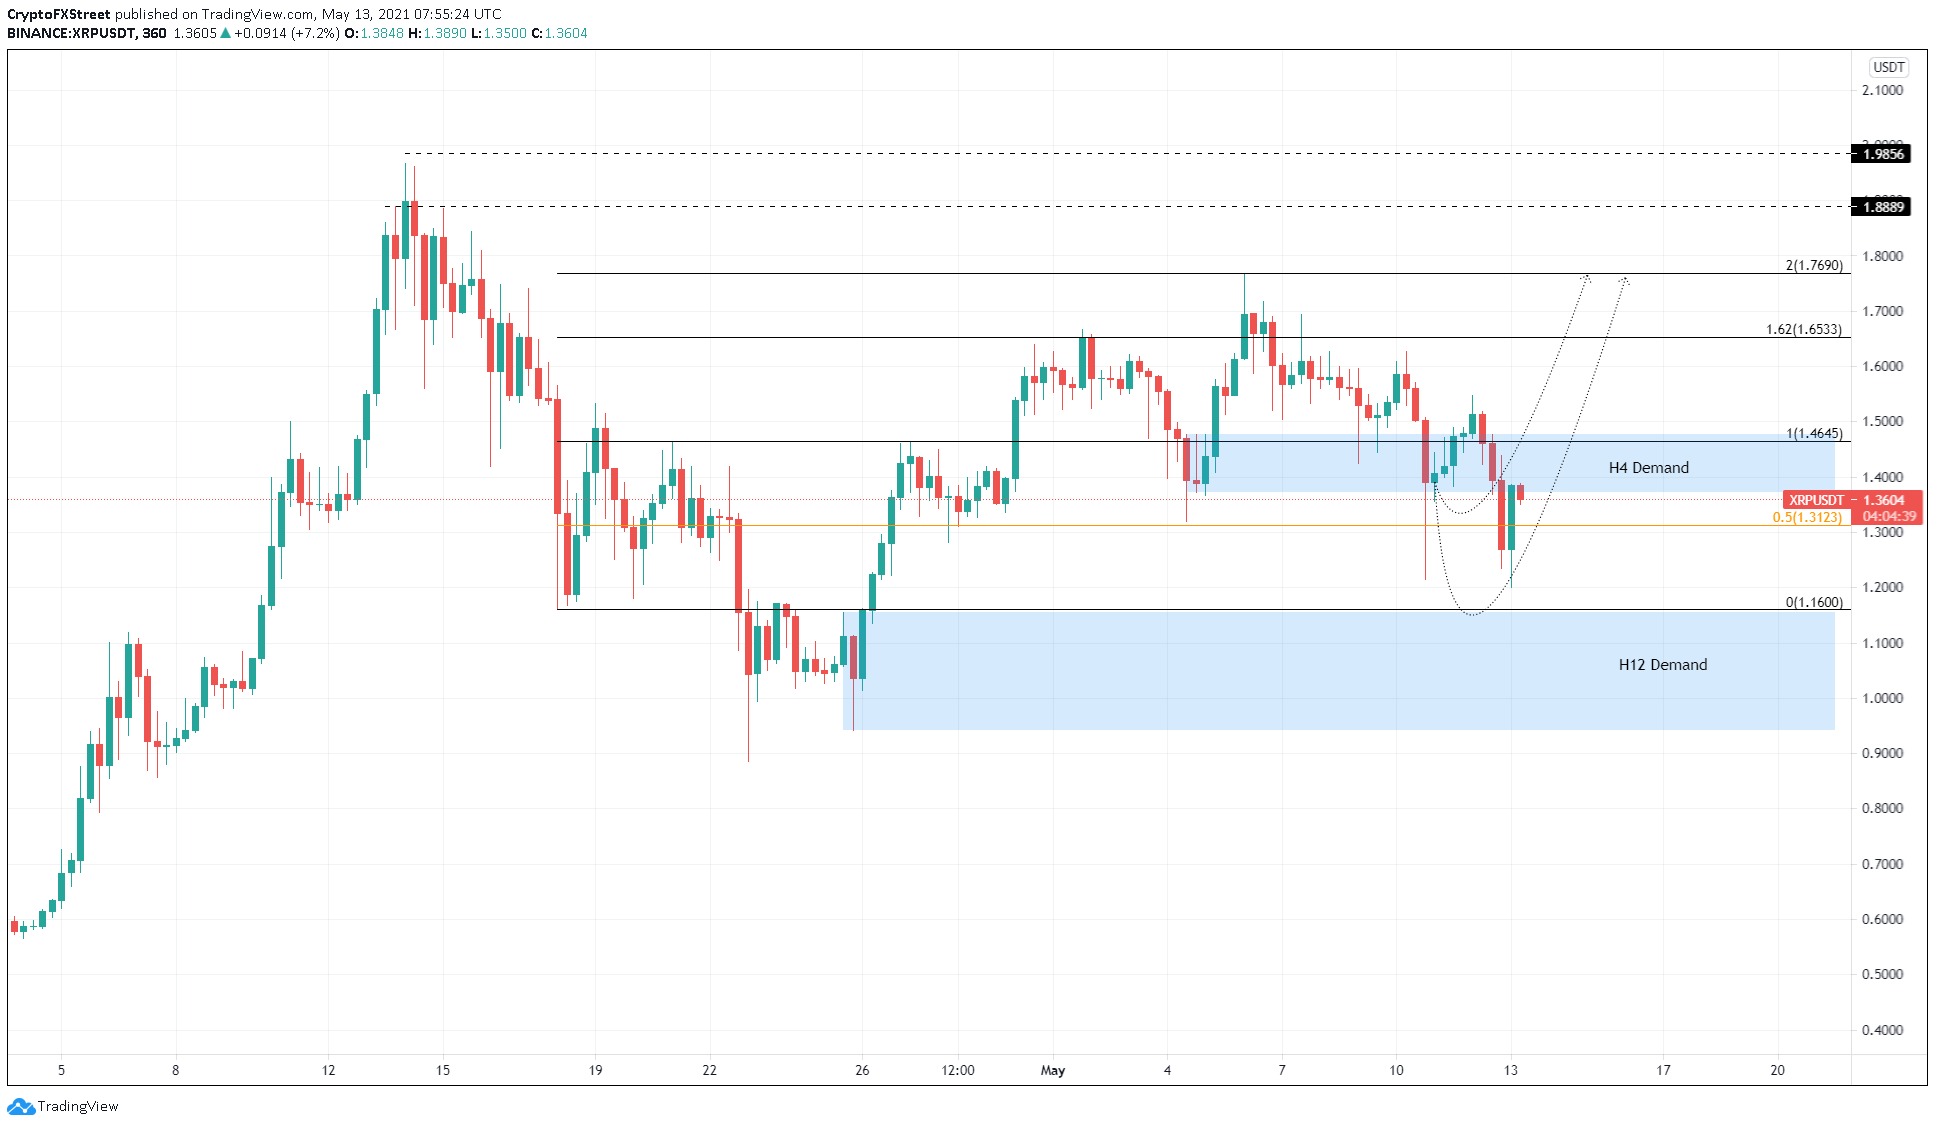
XRP/USDT 6-hour chart
A breakdown of the $0.941 support level will signal overwhelming selling pressure and the start of a new downtrend. Under these dire circumstances, investors could see XRP price drop 6% to tag the swing low created during the crash on April 23 at $0.886.
Author

Akash Girimath
FXStreet
Akash Girimath is a Mechanical Engineer interested in the chaos of the financial markets. Trying to make sense of this convoluted yet fascinating space, he switched his engineering job to become a crypto reporter and analyst.


