Top 3 Price Prediction Bitcoin, Ethereum, Ripple: China’s crackdown intensifies, while BTC suggests minor upswing
- Bitcoin price shows a steady downtrend that could bounce from the support level at $29,936.
- Ethereum price is on the verge of a reversal as it recoils from the demand zone extending from $2,106 to $2,397.
- XRP price looks bearish as it slid below a critical resistance area that stretches from $0.90 to $1.17.

Bitcoin price seems to be facing trouble after the crash on May 19. Ethereum, Ripple and other altcoins have promptly followed the pioneer cryptocurrency south
China tightens the noose around mining
Although other factors played a role, the primary reason for the recent sell-off seems to be attributed to China’s crackdown on Bitcoin and cryptocurrency mining. The latest reports indicate that major mining pools like BTC.TOP and HashCow will suspend their operations as the Vice Premier Liu He-led State Council committee announced the newest clampdown on Friday.
While China is stringent regarding trading Bitcoin and virtual currencies, this is the first time it has turned its scrutiny toward cryptocurrency mining.
Bitcoin price shows signs of life
Bitcoin price looks to surge 40% as it bounces off the support level at $29,936. The daily chart shows that BTC is forming a potential reversal pattern known as head-and-shoulders. This setup contains a central dip referred to as the head, while the other two of comparable depths are known as shoulders.
The swing highs have experienced a sell-off forming horizontal support at $29,936, known as the neckline. A retest of the said demand level will most likely result in a quick run-up to $42,000, forming the right shoulder. A breakdown of the neckline will result in a breakout from this technical formation, projecting a 53% sell-off to $13,891.
This target is obtained by measuring the distance between the head's highest point and the neckline and adding it to the breakout point.
Additional support for this bearish thesis comes in the form of a bearish crossover between the 50-day and 100-day Simple Moving Averages (SMA). This setup is obtained when the 50 SMA moves below the 100 SMA, signaling a rise in the short-term selling pressure. Therefore, investors need to keep a close eye on the demand barrier at $29,936. Other levels of interest include the demand zone extending from $21,864 to $23,835 and $19,703.
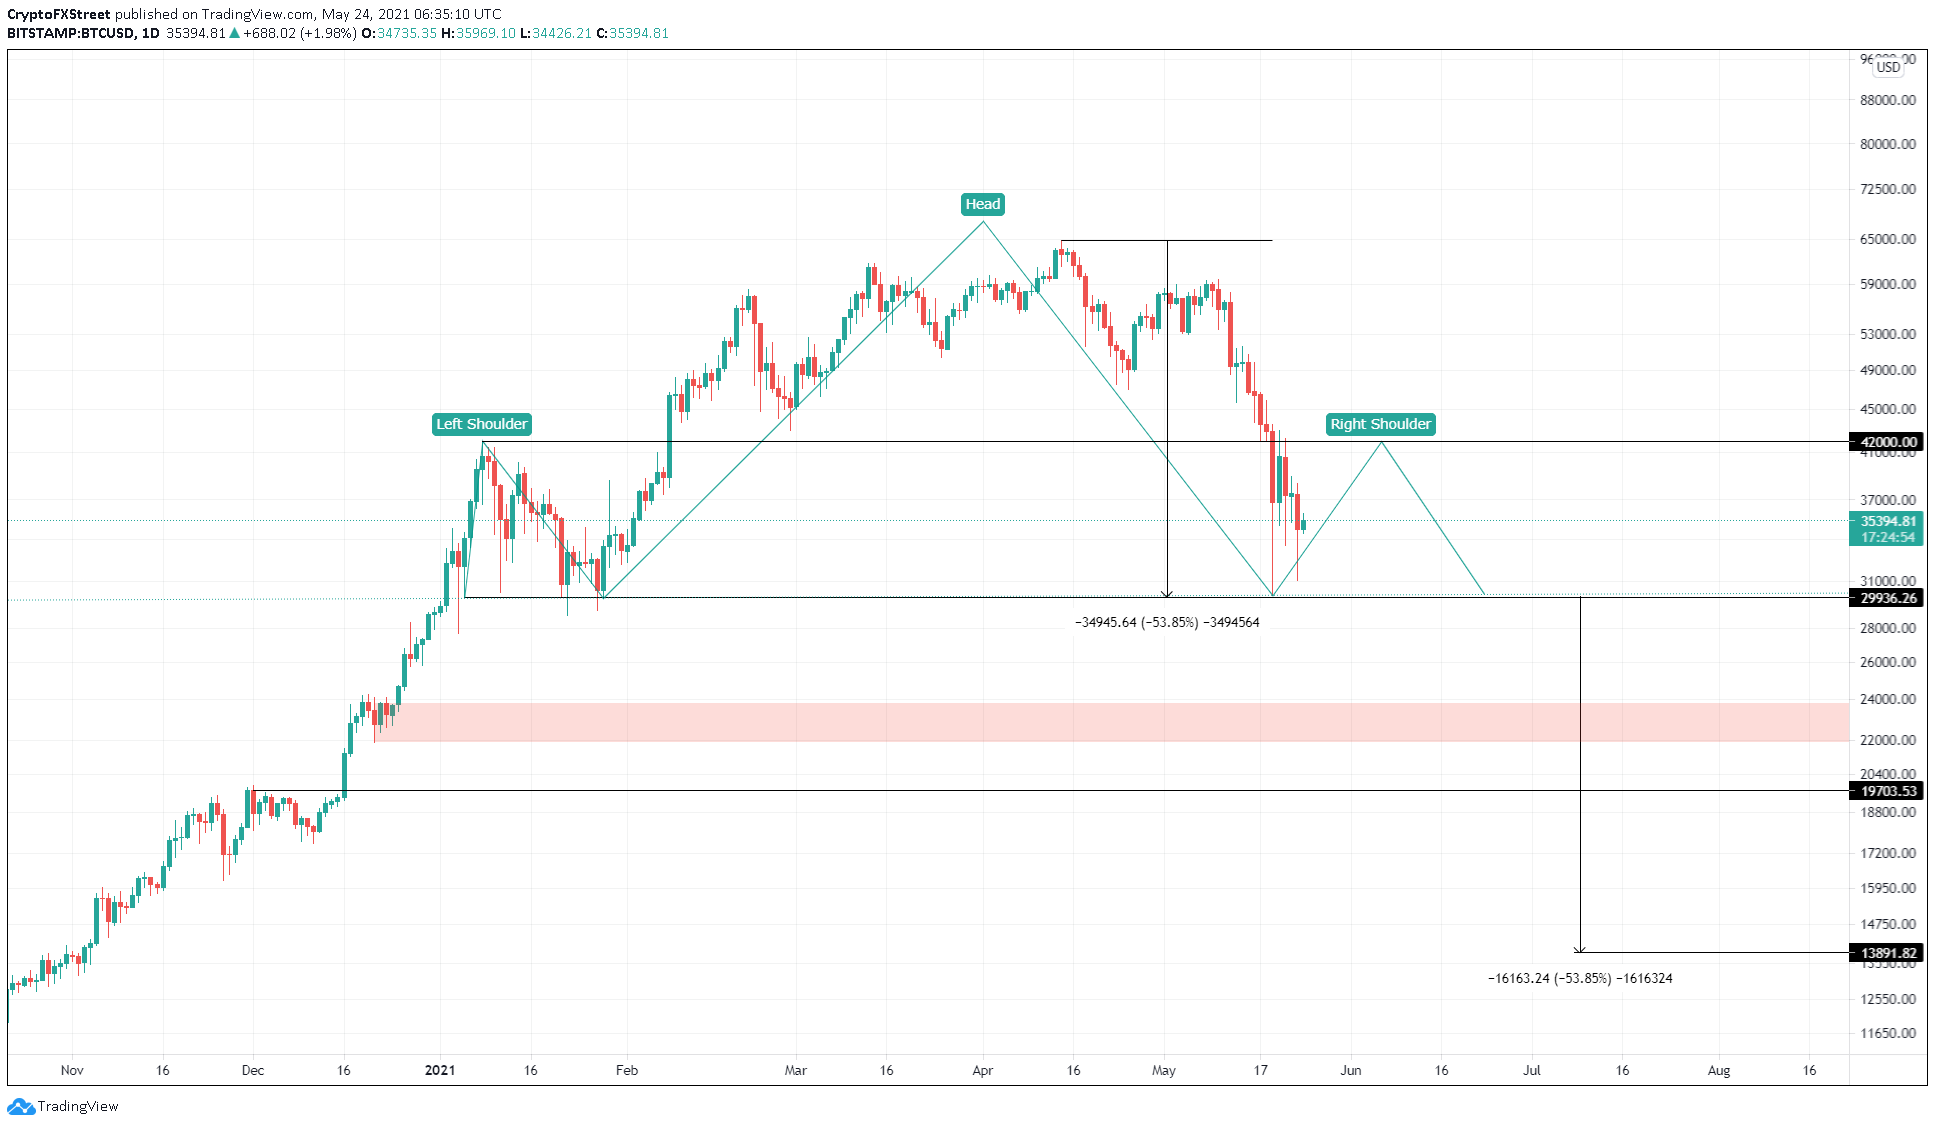
BTC/USD 1-day chart
While the scenario explained above is highly bearish, the bear rally might be cut short at the levels detailed above. Regardless of the pessimistic outlook, if BTC slices through $42,000 and produces a daily candlestick close above $43,000, the bearish thesis will face invalidation. Under these conditions, the flagship cryptocurrency could rally 5% to test $45,000
Ethereum price hints at a reversal
Ethereum price has followed Bitcoin and depreciated roughly 25% since May 19. However, the Momentum Reversal Indicator (MRI) has flashed a buy signal in the form of a green 'one' candlestick. This setup forecasts a one-to-four candlestick upswing.
Additionally, this bullish sign comes as ETH trades in the demand zone, ranging from $2,106 to $2,397.
Therefore, a decisive close above $2,400 will confirm the uptrend thesis. Moreover, a potential spike in buying pressure around this level could propel the altcoin pioneer upward by 15% to tag the 50-day SMA at $2,789.
If the bid orders continue to pile up, ETH price might rise another 7% to tag the swing high formed on May 20 at $3,000. Other critical resistance areas include $3,117 and $3,442.
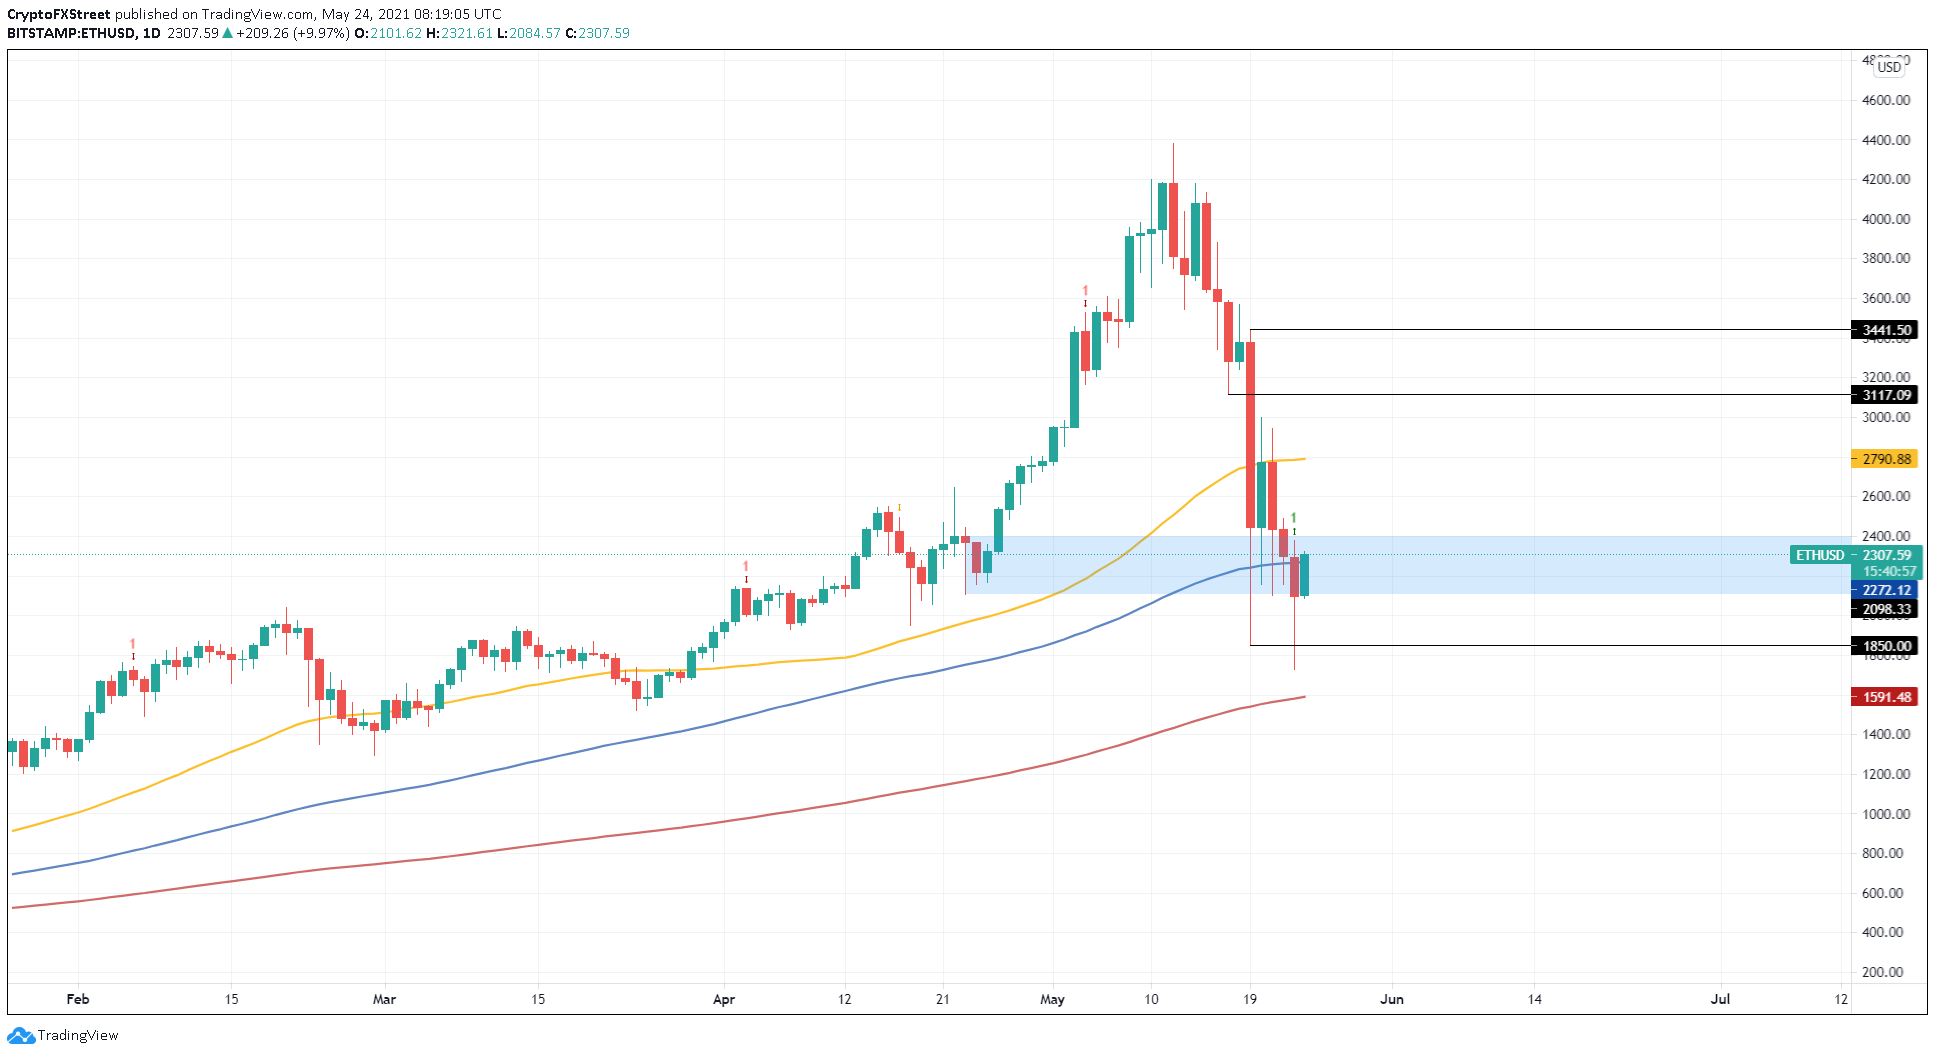
ETH/USD 1-day chart
On the flip side, if Ethereum price slices through $2,098, producing a daily candlestick close below it, it will put an end to the optimistic narrative and kick-start an 11% sell-off to $1,850.
Ripple eyes a quick bounce amid mounting pressure
Ripple price has sparked a minor uptick as it bounced off a support level at $0.793. Although an upswing seems likely, the supply zone extending from $0.90 to $1.178 will hinder the move. Additionally, the 200 twelve-hour SMA at $0.927 will be the first deterrent. Therefore, clearing this will be crucial for an uptrend to establish itself.
Investors can expect XRP to rise roughly another 25% to $1.02 from the current position ($0.823) before exhausting or taking a u-turn.
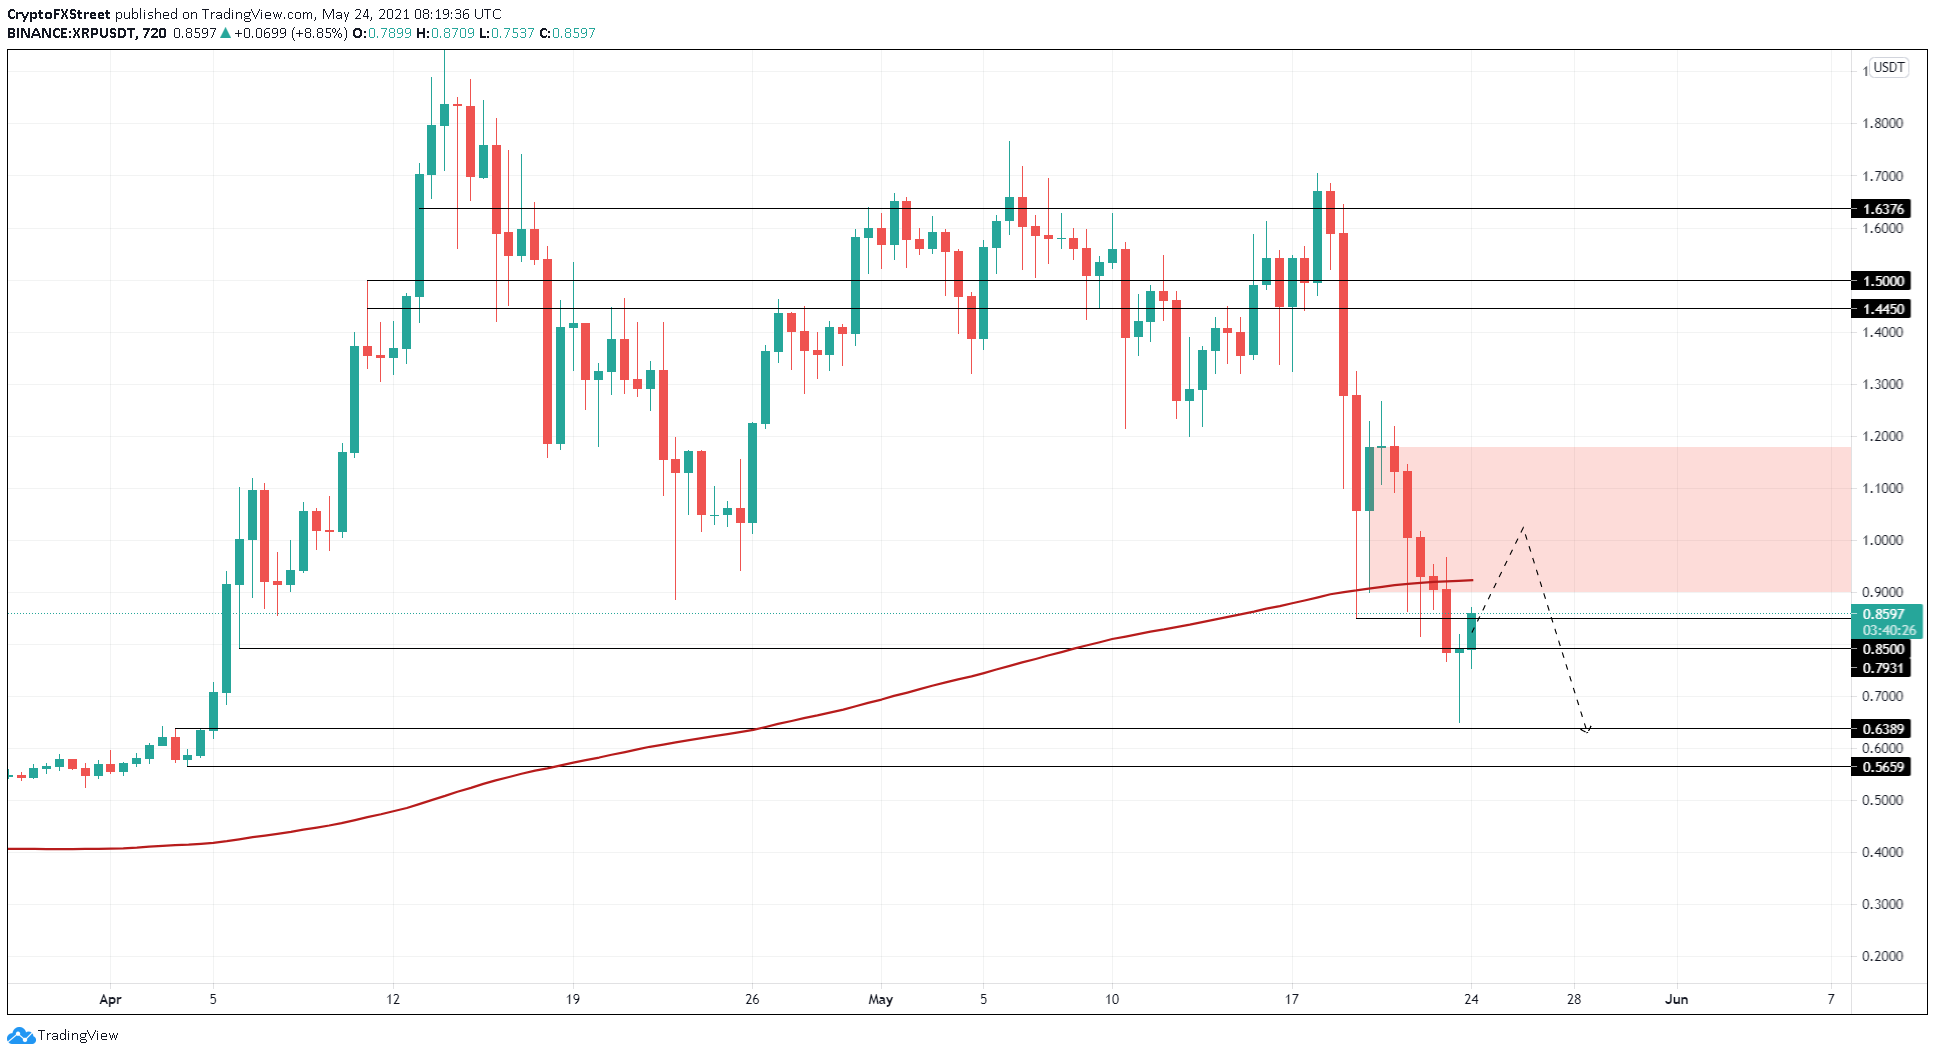
XRP/USD 12-hour chart
If XRP price slices through $0.639, the bullish outlook explained above will face invalidation. In that case, Ripple could slide 12% to $0.566.
Author

Akash Girimath
FXStreet
Akash Girimath is a Mechanical Engineer interested in the chaos of the financial markets. Trying to make sense of this convoluted yet fascinating space, he switched his engineering job to become a crypto reporter and analyst.


