Bitcoin Price Quarterly Forecast: BTC at an inflection point, but fear the reaper
- Bitcoin price closes 2Q down 40%, marking the worst quarter since 4Q 2018 loss of -44%.
- 12-month simple moving average (SMA) has been critical support during BTC corrective phases.
- 50-week SMA is limiting the intra-week selling, maybe offering the basis for a firm bottom.

Bitcoin price logged the worst quarter since 2018 with a -40% loss, breaking an advance that achieved a 1,585% gain from the 1Q2020 low. BTC now faces an uncertain third quarter with definitive support levels, but concerning historical precedents suggest it will be demanding and may notably punish investors for being near-sighted and stubborn.
Bitcoin price may encounter a challenging three months
Based on the price data on Bitstamp going back to 3Q 2011, Bitcoin price has only registered four quarters, including 2Q, with a loss of at least 40%, the most recent occurring in 2018. The average decline of the previous three negative quarters is 50%, indicating that the BTC plunge in the second quarter was milder despite the velocity of the collapse.
One of the things that stands out about the previous three quarters with at least a -40% loss is they were followed immediately by a mild quarter or quarters. For example, after the 55% plunge in 3Q 2011, Bitcoin price closed down 5% in 4Q 2011 and recorded a 7% gain in 1Q 2012. There were tradable moments during the quarters, but there was no BTC price movement for six months using a quarterly closing basis.
A similar situation occurred following the 1Q 2018 loss of -50%. 2Q 2018 logged a -8% drop, and 3Q 2018 registered a minor BTC gain of 3%. Finally, the 3Q 2018 loss of 44% was proceeded by a double-digit Bitcoin price gain of 11%.
Based on historical precedent going back to 2011, Bitcoin price may end the 3Q with an insignificant gain or loss. However, that does not consider the intra-quarter volatility. Based on the high to low prices of the previous instances, the volatility ranged from 85% to 20% in those quarters, with the average being 45%.
Consequently, BTC investors should plan for a volatile three months, but with little price progress on a quarterly closing basis. An ideal environment for swing traders but frustrating for long-term investors operating without precise accumulation levels during intra-quarter pullbacks.
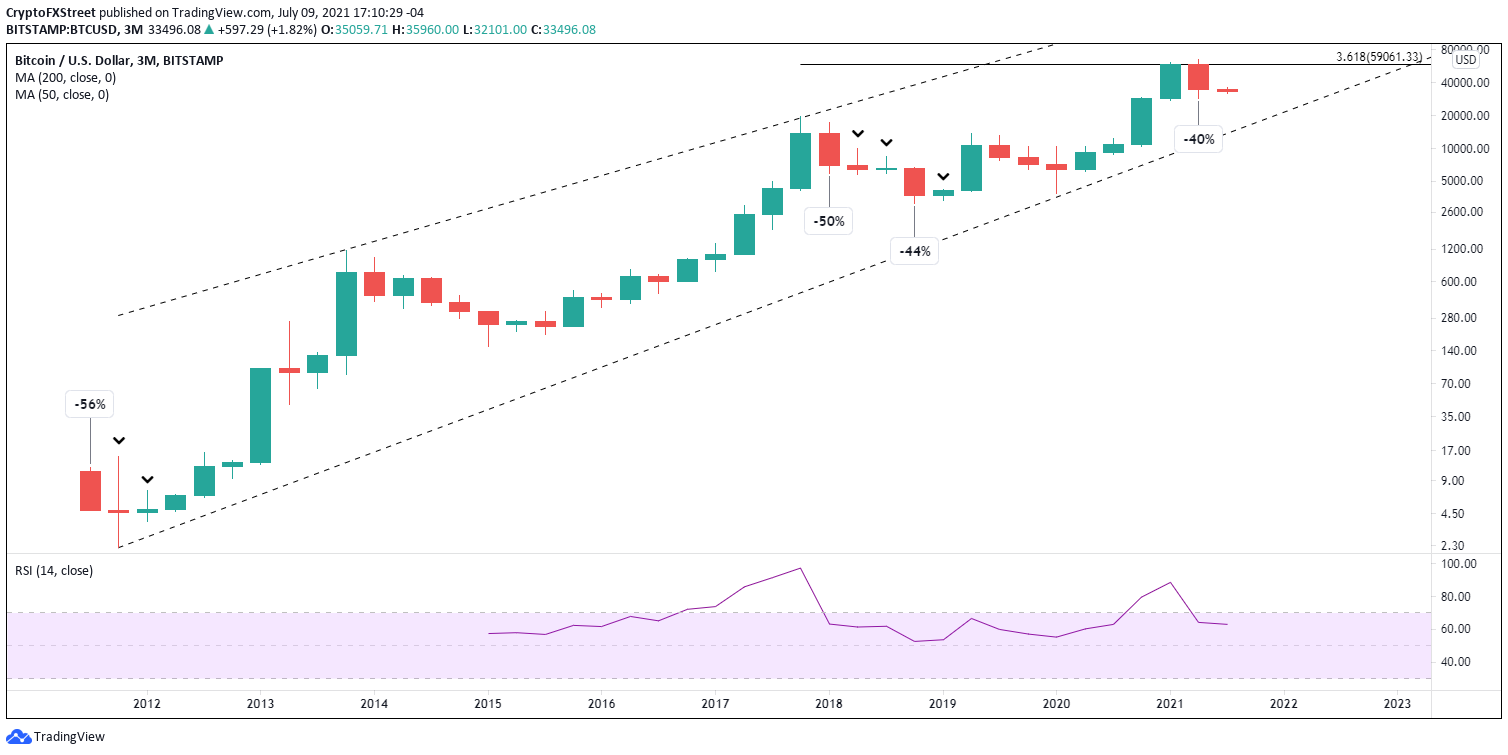
BTC/USD quarterly chart
Bitcoin price at an inflection point for this correction
During bull markets, Bitcoin price has discovered support at the rising 12-month SMA at $32,178 on several occasions, sometimes temporarily and other times igniting a new leg higher. As of June, BTC is testing the 12-month SMA again, putting the flagship cryptocurrency at an inflection point for the rally that began in March 2020.
When evaluated with the monthly Relative Strength Index (RSI), it is an interesting development for Bitcoin price that registered an extreme overbought condition in March. The RSI level was similar to the extreme readings printed in April 2013, November 2013, August 2017 and December 2017.
The declines, peak to trough, that followed the extreme readings ranged from 38% to $87%, with an average loss of 71%. Based on the Bitcoin price high in April of $64,895, the bellwether cryptocurrency should fall to $18,800 based on the average loss. At the current price, a decline to $18,800 would represent a 44% collapse, and it would shutter the resistance attributed to the 2018 high of $19,666.
Overall, the support at the 12-month SMA and the historical precedent of losses following extreme overbought readings on the monthly RSI suggest that Bitcoin is at an inflection point for this correction. If it fails to hold the moving average, BTC could plunge another 44% from the current price.
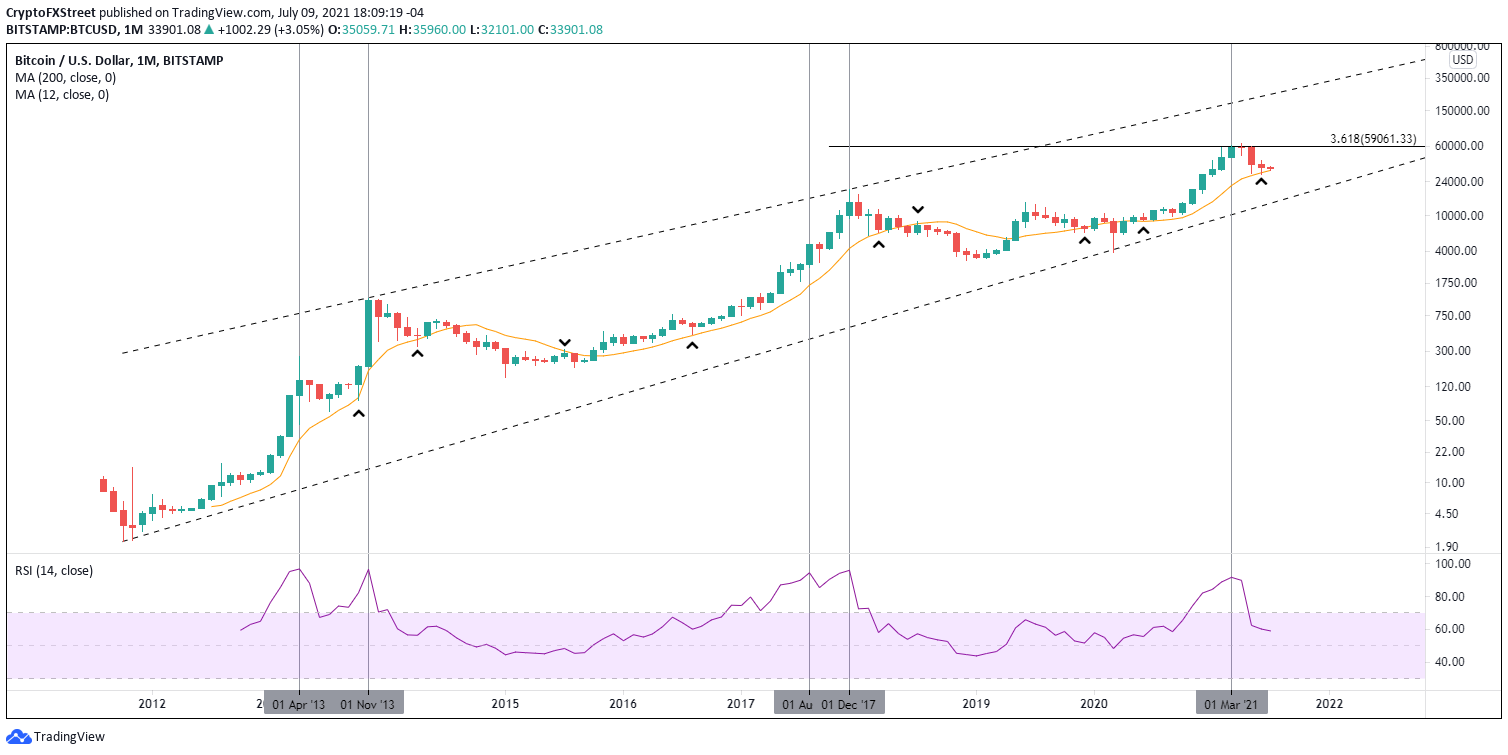
BTC/USD monthly chart
Bitcoin price disarray leaves few clues about future intentions
From mid-February until mid-May, Bitcoin price could not overcome the persuasive resistance of the 3.618 Fibonacci extension of the 2017-2018 bear market at $59,601. In fact, the best attempt coincided with the Coinbase IPO in mid-April. The result was the steep dive in May, highlighted by consecutive weeks with -20% losses.
Since the May low, Bitcoin price has struggled to attract a sustainable bid just above the strategically important 50-week SMA (yellow line), currently at $27,259. A failure to hold the moving average on a weekly closing basis would be a punishing blow to the agents of the bullish BTC narrative.
A weekly close below $27,259 would expose Bitcoin price to a sharp drop to the Anchored VWAP (purple line) from the March 2020 low at $22,493. If the decline gains momentum, BTC will test the 2018 high of $19,666 and potentially seek out the $18,800 target mentioned above in the monthly notes.
Of course, a stampede to the exits could take control of Bitcoin price, pressing BTC down to the 200-week SMA (pink line) at $13,694, which intersects with the June 2019 high of $13,880, generating a 60% loss from the current price. In the worst-case scenario, any additional selling should be contained by the ascending trendline beginning in 2011 at $12,370.
Only a weekly close above the 38.2% retracement of the May-June correction at $42,194 would inspire a rethink of the neutral to bearish posture of the charts.
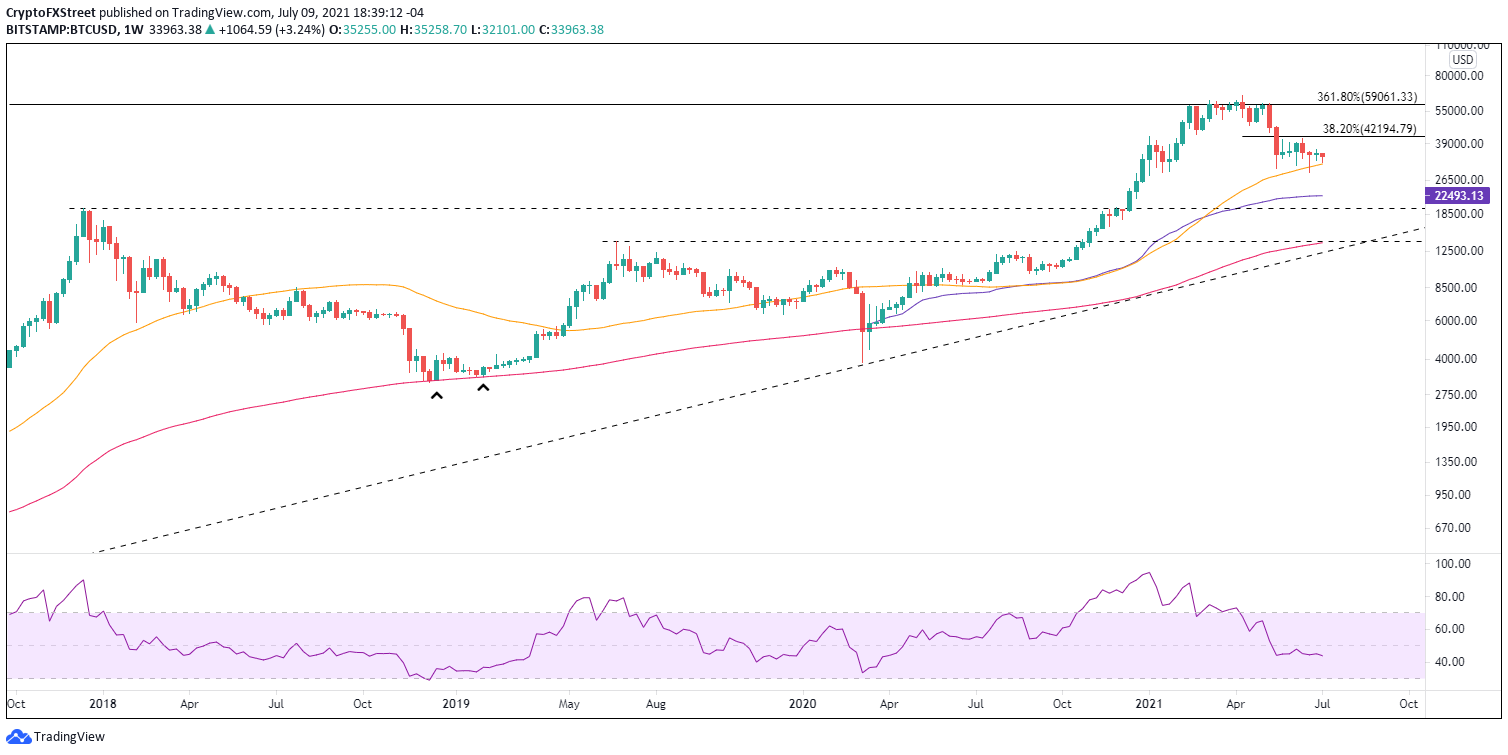
BTC/USD weekly chart
Based on the quarterly chart, Bitcoin price will experience heightened volatility, presenting a rich environment for swing traders, but handcuffing long-term investors with a minor quarterly loss or gain.
From the monthly chart, it can be understood that Bitcoin price is at an inflection point with the 12-month SMA holding price in place. However, in March, the extreme RSI number nearly matched readings that preceded prior career-ending declines, projecting an additional drop of 44% for BTC.
Much like the monthly chart, the weekly chart displays Bitcoin price hovering just above a credible moving average, adding to the view that BTC is at an inflection.
Hence, based on historical precedent and the price structures of three timeframes, BTC investors should anticipate a challenging 3Q, marked with large Bitcoin price swings but no meaningful quarterly gain or loss. If one of those swings bests the key moving averages and locks in a weekly close below $27,259, the digital asset will be vulnerable to another significant collapse that could eventually test the trend line beginning in 2011 at $12,370.
Here, FXStreet's analysts evaluate where BTC could be heading next as it seems bound for a rebound.
Author

Sheldon McIntyre, CMT
Independent Analyst
Sheldon has 24 years of investment experience holding various positions in companies based in the United States and Chile. His core competencies include BRIC and G-10 equity markets, swing and position trading and technical analysis.


