Top 3 Price Prediction Bitcoin, Ethereum and Ripple: Consolidation period starts as bulls and bears cancel each other out
- RSI indicator in the BTC/USD daily chart is trending within the overbought zone.
- The Fear and Greed Index has held steady at around 40 in the "Fear" zone.

Bitcoin, Ethereum, and Ripple bears took control this Thursday to correct this Wednesday’s bullish action. The price action of the coins look like this:
- BTC/USD has gone up from $8,828.49 to $8,829.
- ETH/USD has gone up from $212 to $212.40
- XRP/USD has gone down from $0.2178 to $0.217.
Fear and Greed Index
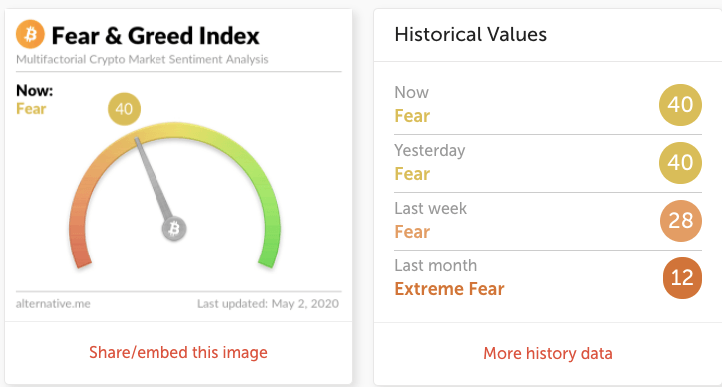
Alternative.me’s fear and greed index has kept steady around 40, and the current market sentiment is still in the “fear” region. This indicates that there is still some upside potential for Bitcoin.
ETH/BTC daily chart
-637239891002883654.png)
ETH/BTC has gone up from 0.0239 to 0.0241 but has failed to keep pace with the green Ichimoku cloud. Bulls must gather enough momentum to break past the 0.0243, the SMA 50 and 0.0248. On the downside, there are healthy support levels at 0.0239 and 0.0235. The MACD shows increasing bearish momentum, while the Elliott Oscillator has had six straight red sessions.
BTC/USD daily chart
-637239894775255845.png)
BTC/USD is currently consolidating in a flag formation below the $9,000 level. The price is sitting just below the upper curve of the 20-day Bollinger Band. On the upside, the price faces strong resistance levels at $9,161.75 and $9444.58. This means that the price can go up to the $9,000-level before encountering resistance. On the downside, there are two healthy support levels at $8,616.20 and $8,191.90. The RSI indicator is hovering at the edge of the overbought zone, showing that the asset is a bit overpriced and may face short-term bearish correction.
ETH/USD daily chart
-637239895351157962.png)
The daily ETH/USD chart is consolidating below the $215-level within the triangle formation. The price faces three strong resistance levels at the upward trending line, $224,78 and $232. On the downside, healthy support levels lie at $206.50 and $198. The RSI is hovering right next to the overbought zone, while the Elliott Oscillator has had eight straight green levels.
XRP/USD daily chart
-637239895943870617.png)
XRP/USD fell from $0.2178 to $0.217 in the early hours of Saturday. This Friday, the price encountered resistance at the 20-day Bollinger Band upper curve and fell down. The widening of the jaw shows increasing price volatility. If the bulls gain back momentum, they’ll need to overcome resistance at the $0.225 line and the SMA 200. Following that, the next resistance level of note lies at $0.2377. On the downside, there are two healthy supports at $0.2125 and $0.203. The Elliott Oscillator has had eight straight green sessions, while the MACD shows increasing bullish momentum.
Author

Rajarshi Mitra
Independent Analyst
Rajarshi entered the blockchain space in 2016. He is a blockchain researcher who has worked for Blockgeeks and has done research work for several ICOs. He gets regularly invited to give talks on the blockchain technology and cryptocurrencies.


