TOP 3 Bitcoin, Ethereum and Ripple Price Prediction: Technical Confluences
-
The big three are looking to consolidate critical levels if they want to continue the upward movement
-
ew levels of confluence below maintain the stress of a short-term development

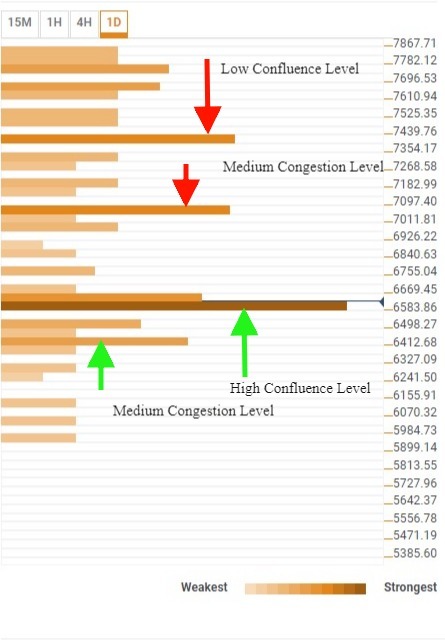
BTC/USD 1D
The BTC/USD is trading around the $6,575 level, where important short-term levels converge, such as the Fibo 38.2% from yesterday's rally, the 4H high, the 1-hour low and up to 10 different technical indicators.
Below that, no significant confluence until the $6,410 level, where the one-month S1(PP) level meets the low band of the Bollinger Bands.
Above, the first major confluence level is at $7,000, where the May lows and the SMA200 at one hour coincide. Already at $7,400, a new significant confluence level where last week's lows and the S1(PP) at one week correspond.
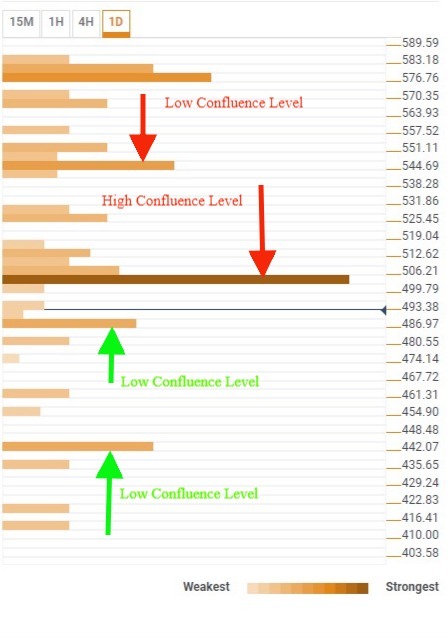
ETH/USD 1D
The ETH/USD moves slightly above $495, just below the strong confluence level of $500. Nine indicators influence this price level, including the May low, the Fibo 38.2 of yesterday's rally and the SMA100 in 15 minutes.
At the bottom, low confluence at $487, with only two technical indicators, and 10% lower at $440, a second, more important confluence level as it includes the first support for the monthly Pivot Points calculation.
On the upside, the first significant level of confluence in the $540 level where converges, among others, in the daily R1 level on daily Pivot Points calculation. The second point of confluence to consider at $576, where we find last week's low and the S1 support level in the weekly Pivot Points calculation.
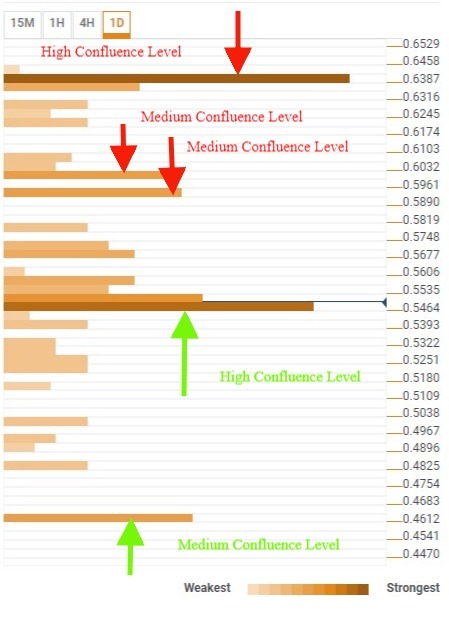
XRP/USD 1D
It is slightly below $0.55, but above a significant confluence level where the May minimum, the hourly minimum, and the 4-hour maximum coincide. The next 5 cents are quite congested by indicators such as Fibo 38.2% of yesterday's rise or multiple moving averages in periods of less than the hour.
Above, at $0.64, another strong confluence zone with Fibo 23.6% in the monthly chart, the first support (S1) of the weekly Pivot Point calculation and the SMA200 at 4H.
In addition to the current support level, the first 5 cents is the S1 on a daily basis, the Bollinger low band on a regular basis and other less critical technical indicators.
It is not until the $0.46 level that we find a vital confluence with the S1 in the monthly Pivot Point calculation or the S3 in the daily Pivot Point calculation of the same technical indicator.
The Confluence Detector finds exciting opportunities using Technical Confluences. The TC is a tool to locate and point out those price levels where there is a congestion of indicators, moving averages, Fibonacci levels, Pivot Points, etc. Knowing where these congestion points are located is very useful for the trader, and can be used as a basis for different strategies.
This tool assigns a certain amount of “weight” to each indicator, and this “weight” can influence adjacents price levels. These weightings mean that one price level without any indicator or moving average but under the influence of two “strongly weighted” levels accumulate more resistance than their neighbors. In these cases, the tool signals resistance in apparently empty areas.
Author

Tomas Salles
FXStreet
Tomàs Sallés was born in Barcelona in 1972, he is a certified technical analyst after having completing specialized courses in Spain and Switzerland. He expanded his technical training following the guidance of great experts on the financial markets.


