Tezos Price Prediction: XTZ is a whisker from all-time highs as technicals remain exceptionally strong
- The daily chart highlights the formation of a golden cross pattern, implying that Tezos uptrend is intact.
- XTZ's liftoff above $4.5 is a conservative prediction based on the prevailing technical picture.
- A correction may come into the picture if the TD Sequential indicator's sell signal is validated.

Tezos is relentless in the fight for all-time highs and perhaps the opportunity to set a historical record. The resistance discussed at $3.5 has been broken, allowing bulls to push XTZ past $4. At the time of writing, Tezos is dancing at $4.05 amid the constant battle to overshoot the all-time highs at $4.5.
Tezos uptrend seems sustainable
XTZ is up 163% from the December low at $1.53. Although the recovery journey has been steady, the most significant price action occurred after Tezos stepped above all the three moving averages, the 100 Simple Moving Average, the 50 SMA, and the 200 SMA on the daily chart.
Recovery in the first week of February has also been continuous, characterized by the liftoff above $3.5. Short term analysis reinforces the bullish scenario as shown by the Moving Average Convergence Divergence (MACD). In addition to being in the positive region (above the zero line), the MACD line (blue) has crossed above the signal line, adding credence to the bullish picture.
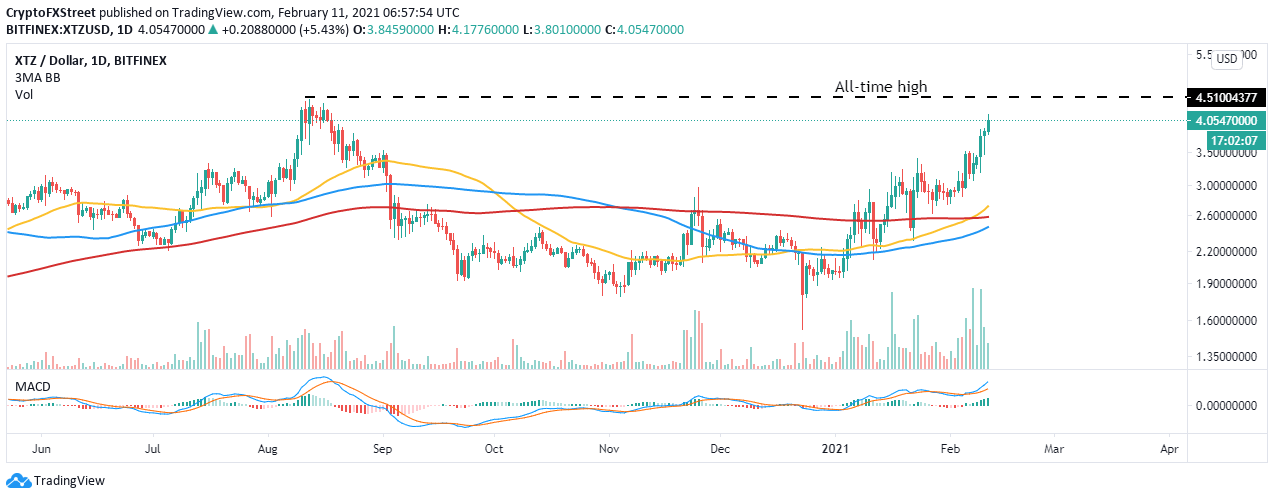
XTZ/USD daily chart
The same daily chart illustrates a golden cross pattern, which is a crucial bullish indicator. The pattern materializes when short-term moving average steps above a longer-term moving average. For instance, the 50 Simple Moving Average (SMA) has recently crossed above the 200 SMA.
Note that the last time this particular pattern occurred was in December 2019 and culminated in a 250% upswing. In other words, if the technical picture remains intact, Tezos' uptrend is just at its initial stages. Thus the all-time high at $4.5 is a conservative prediction.
Looking at the other side of the fence
The TD Sequential indicator has recently flashed a sell signal on the daily chart. The call to sell was revealed in a green nine candlestick. It implies that the uptrend is nearing exhaustion, and it is time to tread carefully.
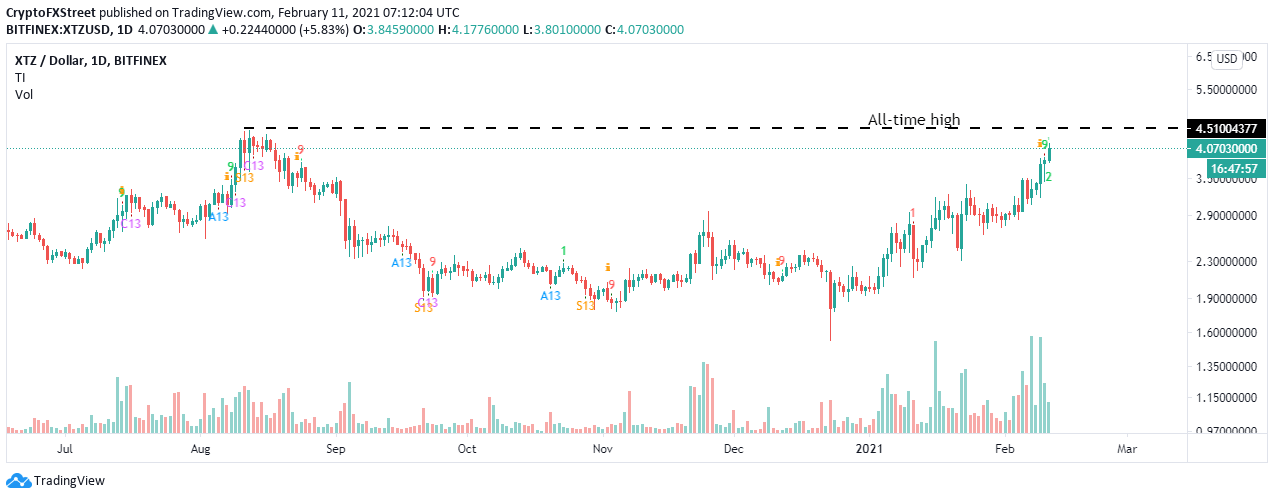
XTZ/USD daily chart
If validated, Tezos could fall in one to four daily candlesticks. The sell signal tells the investors to refrain from buying and consider selling because a reversal is probable. A correction from the current price level will be detrimental to the accrued gains. The formidable support levels include the 50 SMA currently at $2.7, the 100 SMA at $2.45.
Author

John Isige
FXStreet
John Isige is a seasoned cryptocurrency journalist and markets analyst committed to delivering high-quality, actionable insights tailored to traders, investors, and crypto enthusiasts. He enjoys deep dives into emerging Web3 tren


