Tezos Price Analysis: XTZ is only one bump away from all-time highs
- Tezos battles the resistance at $3.5 for an ultimate breakout to the $4.5 all-time high.
- A bullish pennant pattern on the 4-hour chart hints at a potential trend toward $4.5.
- XTZ will turn bearish if the barrier at $3.5 remains unshaken in the near term.

Tezos is up 113% in less than six weeks to trade at $3.39. The bullish momentum has been consistent, in tandem with the bull run in the cryptocurrency market. However, the uptrend stalled on hitting September 2020 resistance at $3.5. XTZ is likely to break out to its all-time highs of around $4.5 if it closes the day or settles above $3.5.
Tezos bullish momentum remains persistent
Despite the stalling under $3.5, Tezos’s uptrend is still intact, especially when the Moving Average Convergence Divergence (MACD) is closely monitored. This indicator tracks the momentum of an asset as well as the trend direction. Traders spotting entry and exit positions can also utilize it.
For instance, when the MACD line (blue) crosses above the signal line, we can expect the price to increase. On the other hand, exploring the levels under the signal line signifies the beginning of a downtrend. For now, the MACD shows that the uptrend is intact, thus the expected uplift to $4.5.
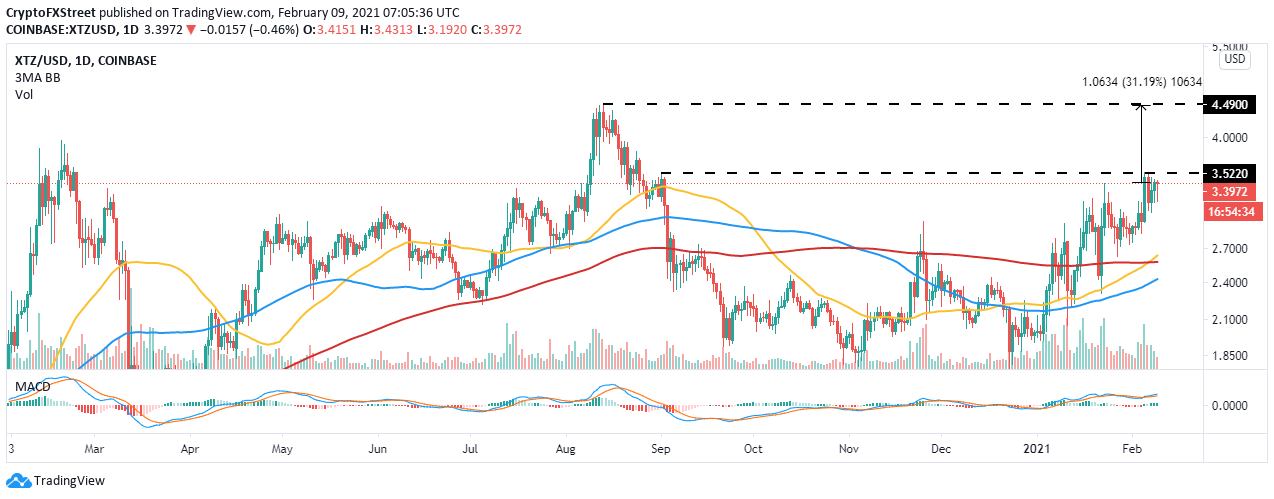
XTZ/USD daily chart
The 4-hour chart shows the formation of a bullish pennant pattern, which signifies a trend continuation. A bullish pennant is formed by a rising flag pole followed by consolidation in a short-term triangle. The consolidation is succeeded by a breakout in the same direction as the previous trend, thus validating Tezos’s possible rally to $4.5.
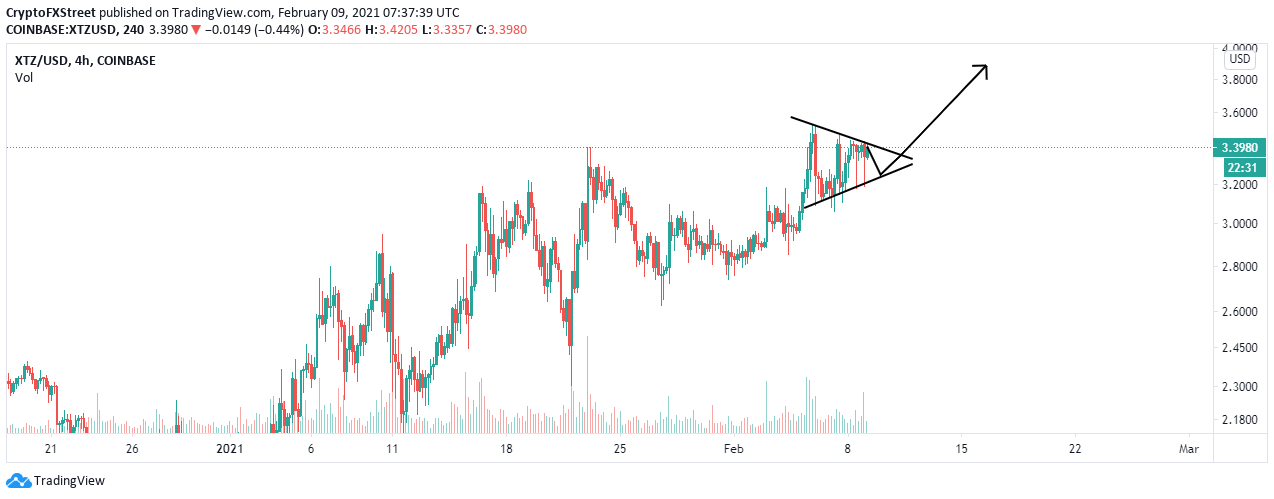
XTZ/USD 4-hour chart
Looking at the other side of the picture
Despite the bullish outlook, it is important to realize that the upswing to $4.5 may fail to come to fruition mostly if Tezos fails to overcome the selling pressure at $3.5 (September 2020 resistance). The MACD line crosses under the signal line on the daily will also highlight a probable breakdown.
On the downside, support is expected at the 50 Simple Moving Average, currently at $2.7. Other support levels to have in mind are the 100 SMA, holding at $2.4, and the primary buyer congestion at $1.85.
Author

John Isige
FXStreet
John Isige is a seasoned cryptocurrency journalist and markets analyst committed to delivering high-quality, actionable insights tailored to traders, investors, and crypto enthusiasts. He enjoys deep dives into emerging Web3 tren


