Stellar Price Forecast: XLM risks revisiting $0.136 as sell-off continues
- Stellar price extends its correction on Wednesday, printing the fifth consecutive red daily candle.
- Bearish sentiment strengthens, with short bets rising to the highest level in over a month, alongside declining open interest.
- The technical outlook suggests XLM could revisit $0.136 if the correction persists.

Stellar (XLM) is trading below $0.160 at the time of writing on Wednesday, extending its correction for the fifth consecutive day. The bearish price action is further supported by rising short bets and declining Open Interest (OI) in the derivatives market. At the same time, technical analysis suggests a deeper correction for XLM in the upcoming days.
Derivatives data show a negative outlook
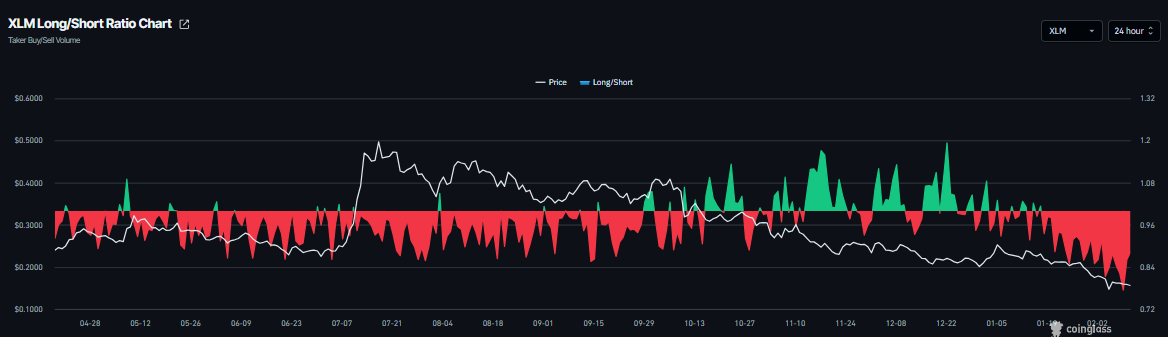
Derivatives data for Stellar support a bearish outlook. XLM’s long-to-short ratio is at 0.77 on Wednesday, the lowest level in over a month. This ratio, being below one, indicates bearish sentiment in the market, as more traders are betting on XLM’s price to fall.
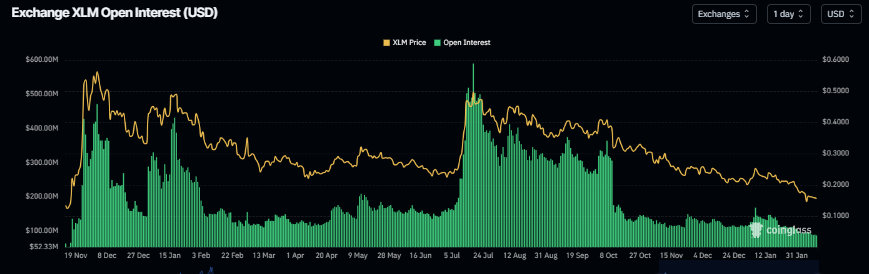
In addition, XLM’s futures Open Interest (OI) drops to $87.07 million on Wednesday, reaching levels not seen since mid-November 2024, and has been steadily falling since the January 6 high of $166.99 million. This drop in OI reflects waning investor participation and projects a bearish outlook.
Stellar Price Forecast: XLM bear's aiming for $0.136 mark
In the daily chart, XLM/USDT trades at $0.155 at the time of writing. The 9-day Simple Moving Average (SMA) slopes lower and sits above Stellar's price, underscoring the persistent bearish bias. Price holds below this gauge, with the SMA at $0.161 acting as near-term resistance. A descending trendline from $0.5285 caps rebounds, with resistance located near $0.203.
The Moving Average Convergence Divergence (MACD) indicator remains below the Signal line and under the zero mark on the same chart, keeping a negative bias. The contracting negative histogram suggests fading bearish momentum. The Relative Strength Index (RSI) sits around 30, near oversold, where a corrective bounce could emerge. A daily close back above the 9-day SMA would open room for an extension toward the trendline resistance, while failure to reclaim it would keep the downside in focus toward Friday's low of $0.136.
(The technical analysis of this story was written with the help of an AI tool.)
Author

Manish Chhetri
FXStreet
Manish Chhetri is a crypto specialist with over four years of experience in the cryptocurrency industry.