- Shiba Inu price could be headed for a major upswing as the token has formed an optimistic chart pattern.
- SHIB bulls could be aiming for a 51% climb toward $0.00005336 if the canine-themed token slices above $0.00003468.
- However, if Shiba Inu falls below $0.00002368, the optimistic forecast may be voided.
Shiba Inu price is preparing for a significant uptick following the formation of a bullish chart pattern. However, SHIB must slice above multiple obstacles ahead in order to validate the optimistic technical pattern.
Shiba Inu bulls eye 51% ascent
Shiba Inu price is forming an ascending triangle pattern on the daily chart, which projects a 51% ascent from the topside trend line of the governing technical pattern toward $0.00005336.
Shiba Inu price must overcome multiple challenges before the bullish target would be put on the radar. The first hurdle will emerge at the 38.2% Fibonacci retracement level, coinciding with the 50-day Simple Moving Average (SMA) at $0.00002561.
Additional obstacles may appear at the 50% retracement level at $0.00002826, intersecting with the 21-day SMA and the 200-day SMA.
Shiba Inu price will face further resistance at the 100-day SMA at $0.00003169 before SHIB bulls attempt to reach the upper boundary of the prevailing chart pattern at $0.00003468, coinciding with the 78.6% Fibonacci retracement level.
If Shiba Inu price manages to slice above the aforementioned level of resistance, the 51% climb toward $0.00005336 could be in the offing.
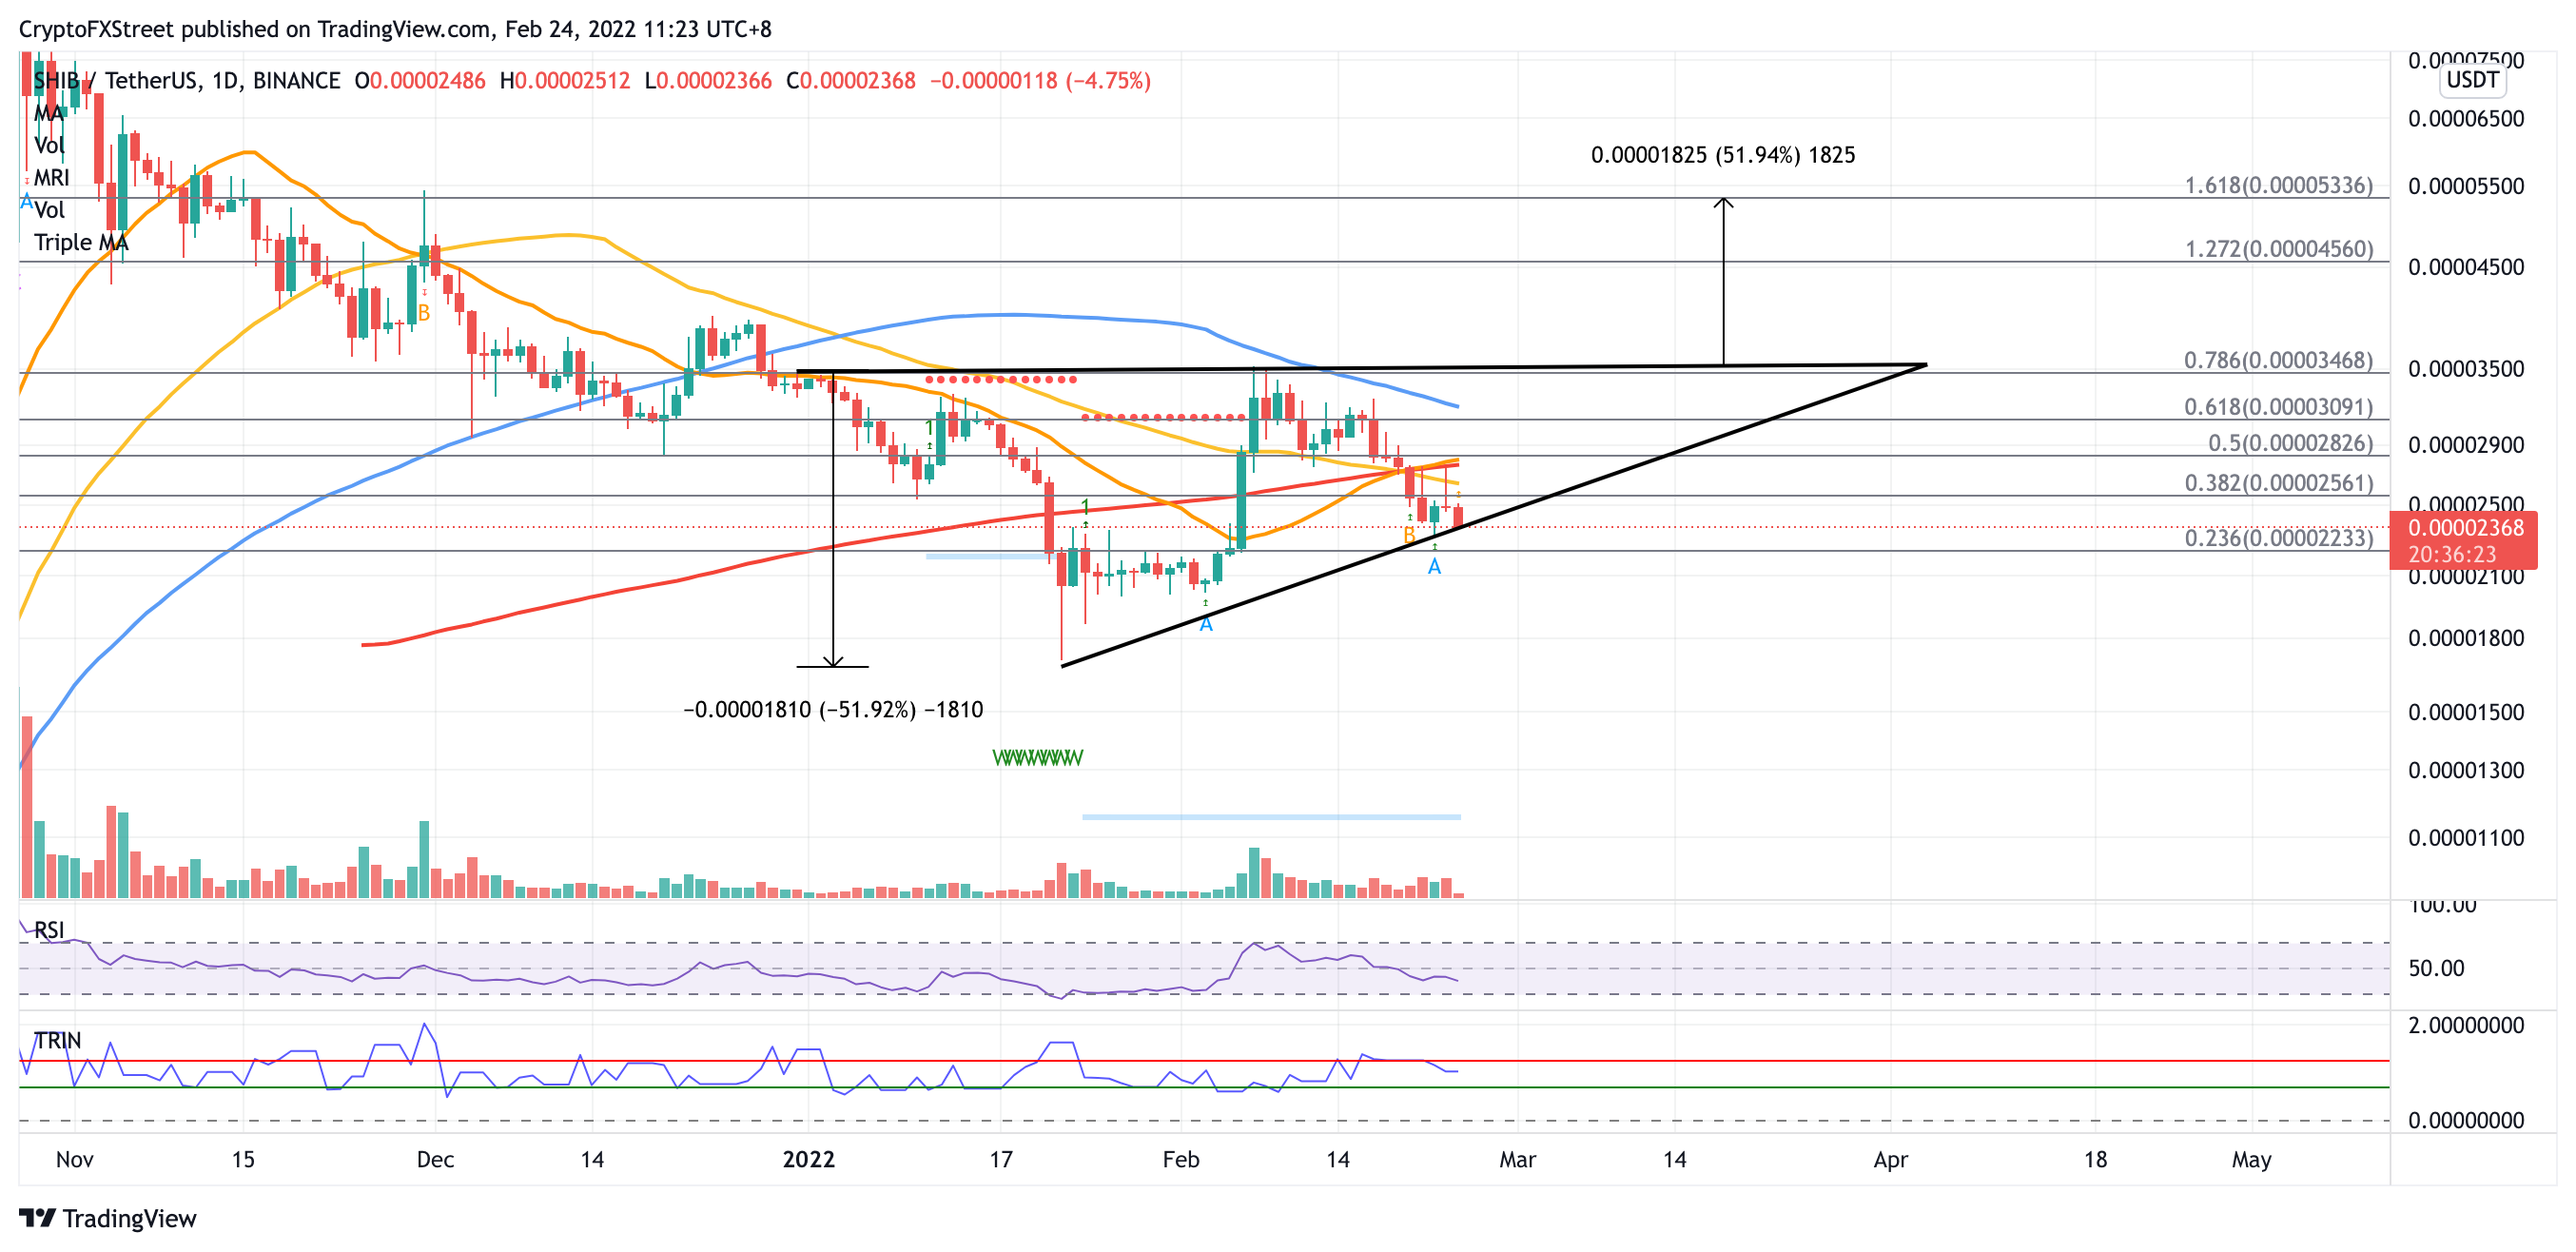
SHIB/USDT daily chart
If selling pressure increases, Shiba Inu price could test the lower boundary of the governing technical pattern at $0.00002368. If bearish sentiment continues to increase, SHIB could fall toward the 23.6% Fibonacci retracement level at $0.00002233.
However, if Shiba Inu price slices below the downside trend line of the prevailing chart pattern, the bullish chart pattern may be invalidated.
Shiba Inu price could continue tumbling toward the January 26 low at $0.00001990, then toward the January 22 low at $0.00001672.
Note: All information on this page is subject to change. The use of this website constitutes acceptance of our user agreement. Please read our privacy policy and legal disclaimer. Opinions expressed at FXstreet.com are those of the individual authors and do not necessarily represent the opinion of FXstreet.com or its management. Risk Disclosure: Trading foreign exchange on margin carries a high level of risk, and may not be suitable for all investors. The high degree of leverage can work against you as well as for you. Before deciding to invest in foreign exchange you should carefully consider your investment objectives, level of experience, and risk appetite. The possibility exists that you could sustain a loss of some or all of your initial investment and therefore you should not invest money that you cannot afford to lose. You should be aware of all the risks associated with foreign exchange trading, and seek advice from an independent financial advisor if you have any doubts.
Recommended Content
Editors’ Picks
Ripple's move above this key level could trigger nearly 50% rally for XRP
Ripple has overcome a critical resistance level and flipped into a support floor on the weekly time frame. This development happened while XRP tightly consolidated for roughly 250 days. Investors can expect XRP to kickstart a massive rally.
Optimism price outlook with nearly $90 million worth of OP tokens flooding markets on Friday
Optimism volatility has shrunk in the ours leading to the network’s cliff unlock. It joins the likes of dYdX and Sui, which have similar events on their calendars. As token unlocks are often considered bearish catalysts, investors should brace for a reaction after the event.
Top 3 Price Prediction Bitcoin, Ethereum, Ripple: Retail watches from the sidelines with a bias for shorts
Bitcoin could clear $73,777 peak as BTC bulls resurface. Ethereum might fall 10% before next leg up as ETH RSI teases with sell signal. XRP could lose $0.6000 threshold as Ripple bulls fail to show up.
Jito price could hit $6 as JTO coils up inside this bullish pattern
Jito price action shows a potential cup and handle formation. Based on theoretical measurement rules, a successful breakout could yield a 56% rally to $6.0. A breakdown of the $3.86 support level would create a lower low for JTO and invalidate the bullish thesis.
Bitcoin: BTC may have recovered, but is it out of the woods?
Bitcoin’s (BTC) upward momentum has shown a significant decline for the past two weeks or so. This development led to a bearish signal on the weekly and an uncertain outlook on the monthly.