Sandbox Price Prediction: SAND bulls eye a retest of $6
- Sandbox price has left a demand zone, extending from $4.21 to $4.77 as it rallied 20%.
- Investors can expect SAND to continue this ascent to $5.50 and $6.
- A four-hour candlestick below the $4.21 support level will invalidate the bullish thesis.

Sandbox price is noticing a minor slowdown after its recent uptrend. Although SAND could see a minor setback, the uptrend is likely to continue, considering the bullish nature of the crypto market.
Sandbox price prepares for the second leg
Sandbox price rallied 20%, creating a demand zone, stretching from $4.21 to $4.77. Investors can expect SAND to retrace lower after this run-up and in some cases, the pullback could retest the said demand zone.
This move could strengthen the support area and could be key in triggering another rally. Market participants can expect SAND to make a run for the $5.52 resistance barrier, constituting a 15% ascent from $4.77.
However, Sandbox price is likely to extend beyond this level and tag the $6 psychological level. In total, this run-up would represent a 25% gain and is likely where SAND will form a local top.
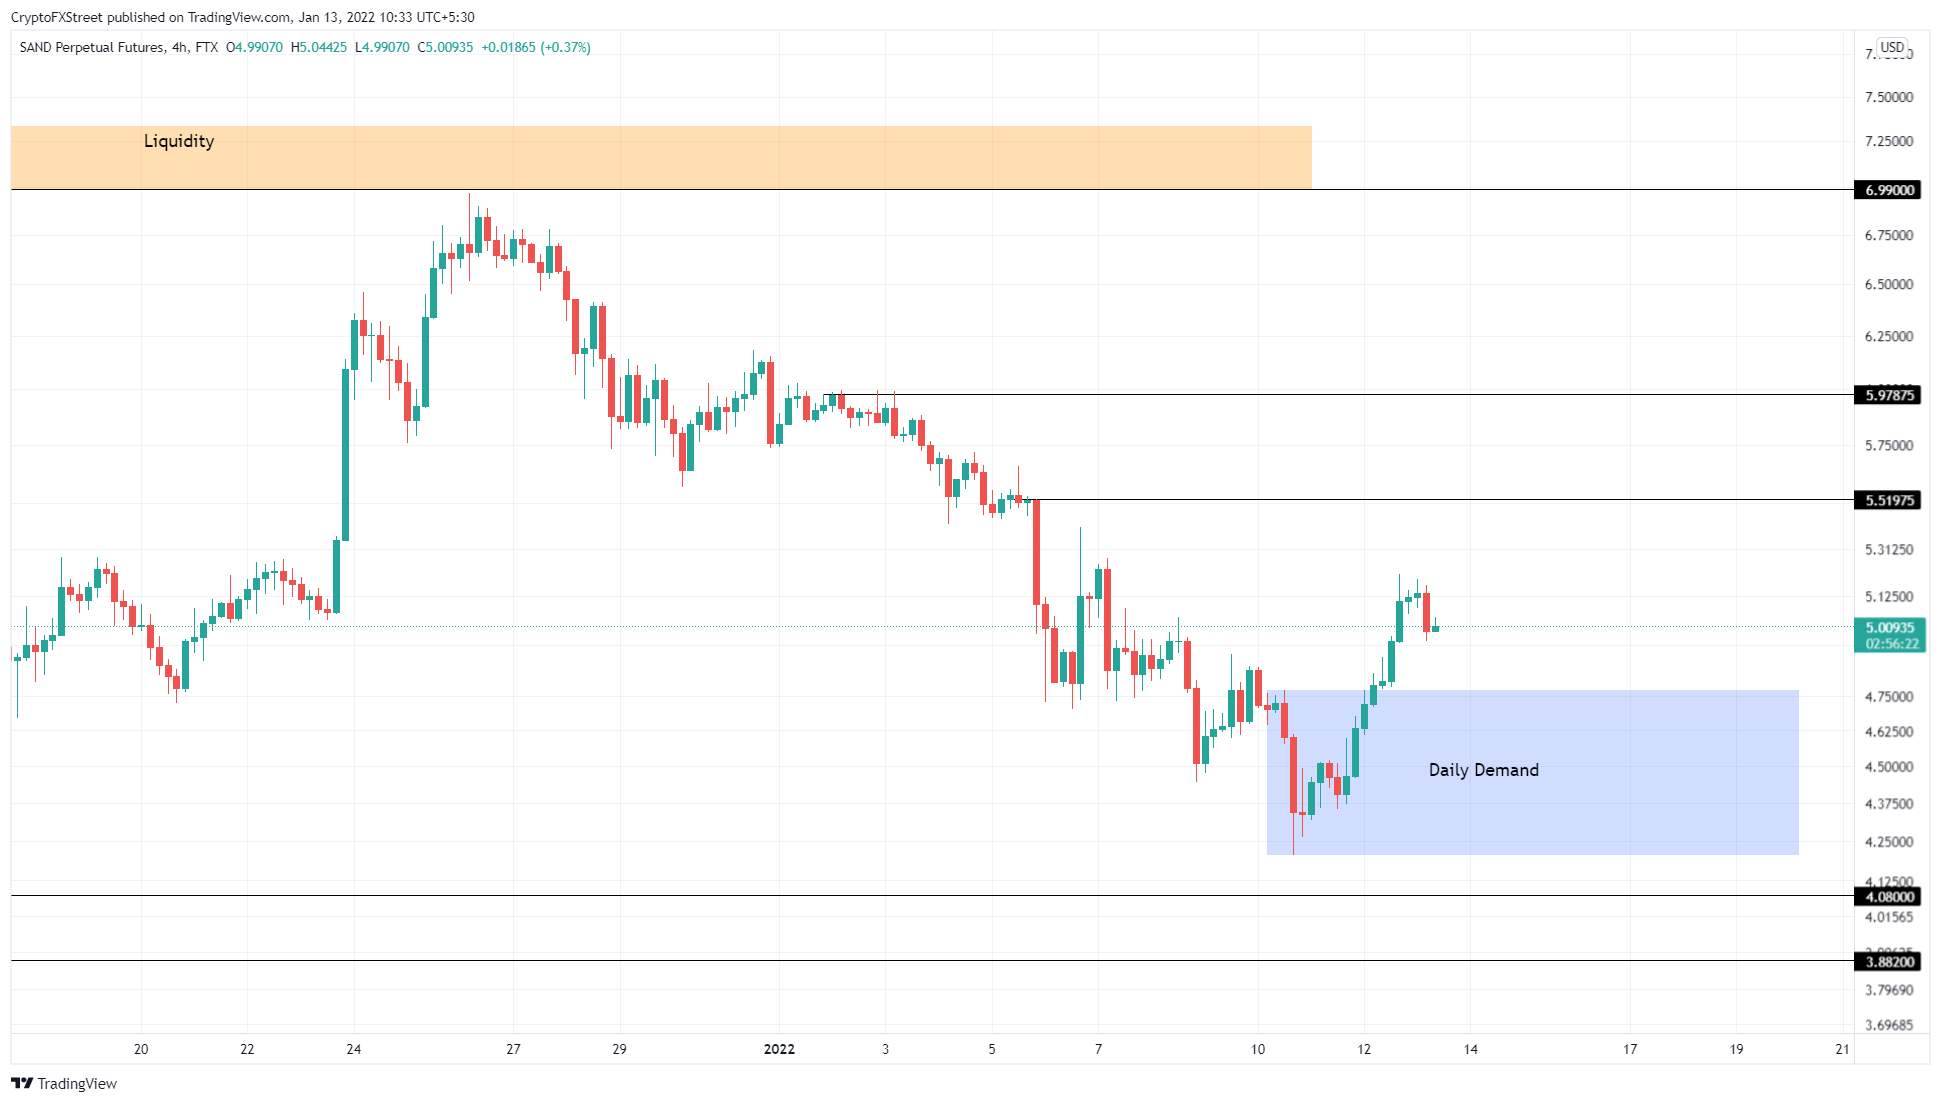
SAND/USDT 4-hour chart
While things are looking up for Sandbox price, a breakdown of the daily demand zone, ranging from $4.21 to $4.77 will indicate a weakness among buyers.
A four-hour candlestick close below $4.21 will create a lower low, invalidating the bullish thesis for SAND. This move could open the path for Sandbox price to head lower and retest the $4.08 support level, where buyers could attempt another comeback.
Should the selling pressure remain high, SAND could revisit the $3.88 foothold.
Author

Akash Girimath
FXStreet
Akash Girimath is a Mechanical Engineer interested in the chaos of the financial markets. Trying to make sense of this convoluted yet fascinating space, he switched his engineering job to become a crypto reporter and analyst.


