Sandbox Price Forecast: SAND bulls eyes for $1 mark
- Sandbox price extends its gains on Monday after rallying more than 16% the previous week.
- On-chain data paints a bullish picture as SAND’s open interest and whale transactions are rising.
- A weekly candlestick close below $0.46 would invalidate the bullish thesis.

Sandbox (SAND) price extends its gains by 7% and trades around $0.68 at the time of writing on Monday after rallying more than 16% the previous week. On-chain data paints a bullish picture, as SAND’s open interest and whale transactions are rising. The technical outlook suggests a rally continuation, with a target toward the $1 mark.
Sandbox price looks promising
Sandbox price found support around the previous broken descending trendline drawn by connecting multiple highs from July 2022. It bounced 18% from mid-December to the end of the month. On Monday, the gains extend by 7%, trading around $0.68 at the time of writing.
If SAND continues its upward momentum, it could extend the rally by 45% to retest the 61.8% Fibonacci retracement level, drawn from the July 2022 high of $1.49 to the August 2024 low of $0.20, at $1.00.
The Relative Strength Index (RSI) on the weekly chart reads at 59, above its neutral level of 50 and pointing upwards, indicating bullish momentum is gaining traction.
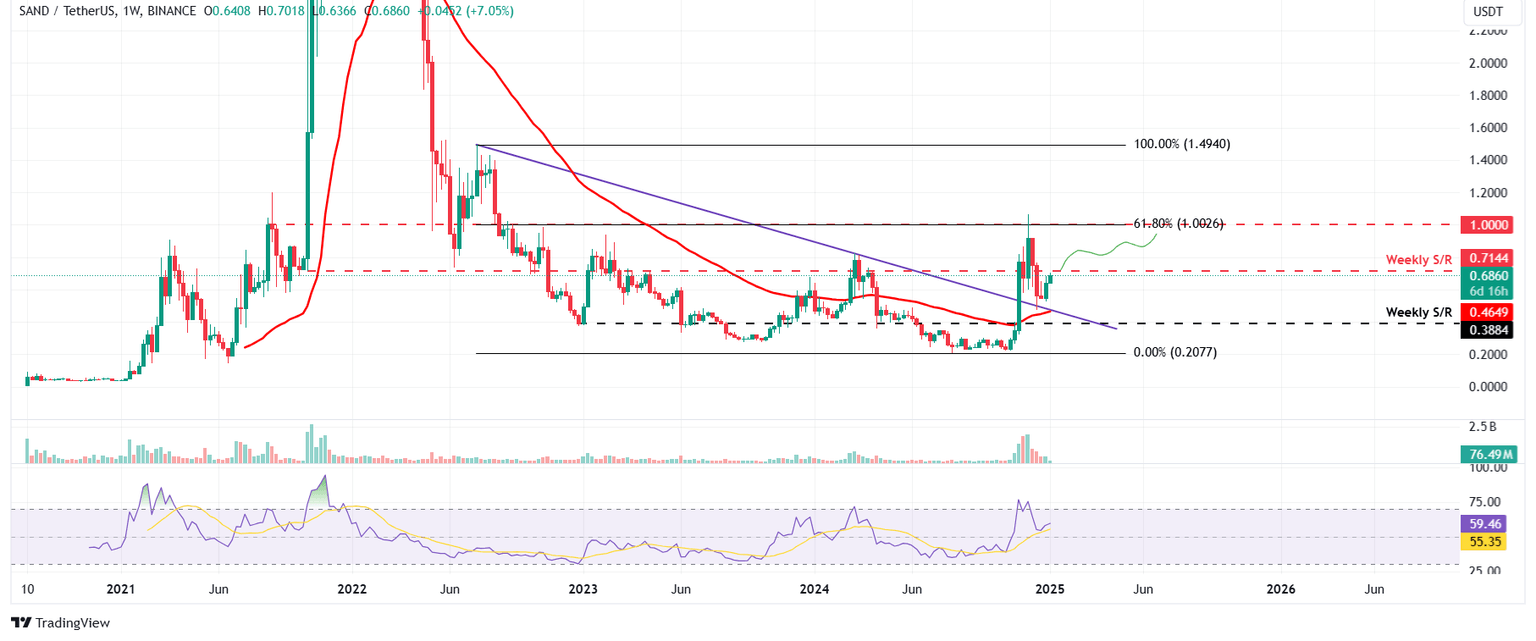
SAND/USDT weekly chart
Coinglass’s data shows that the futures’ Open Interest (OI) in SAND at exchanges rose from $82.78 million on Wednesday to $150.26 million on Monday, reaching the highest level since December 12. An increasing OI represents new or additional money entering the market and new buying, which suggests a rally ahead in the Sandbox price.
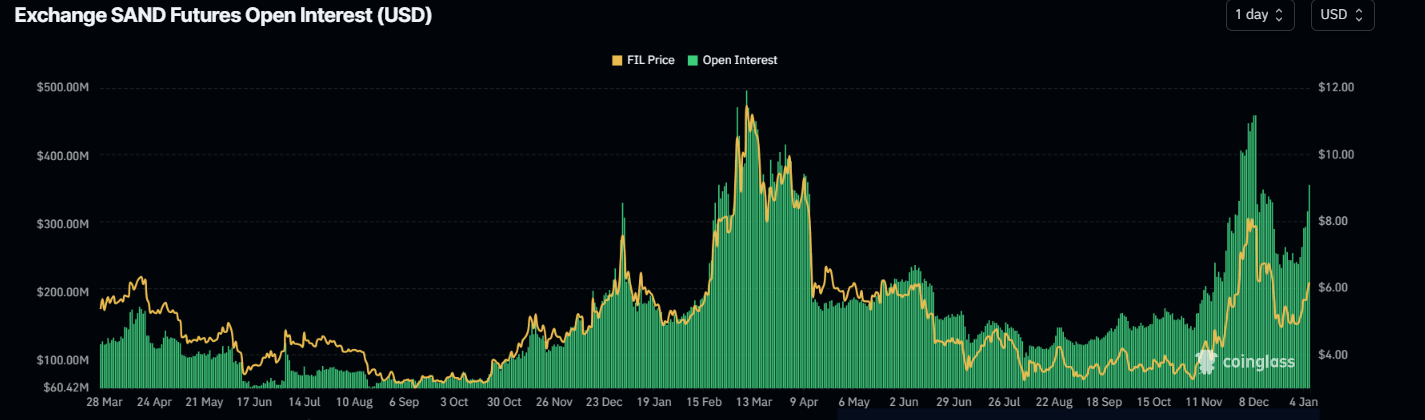
SAND Open Interest Chart. Source: Coinglass
Santiment’s Whale Transaction Count (>100K USD) shows rising spikes, indicating increasing whale activity. Moreover, the Exchange Flow Balance for SAND shows a negative value, indicating more SAND left the exchange than entered. This indicates less selling pressure from investors, adding further credence to the bullish outlook.
%2520%5B13.13.14%2C%252006%2520Jan%2C%25202025%5D-638717501530093140.png&w=1536&q=95)
SAND Whale Transaction Count (>100K USD) and Exchange Flow Balance chart. Source: Santiment
However, if the SAND weekly candlestick closes below its 50-week Exponential Moving Average (EMA) at $0.46, the bullish thesis would be invalidated, leading to a price decline toward the next weekly support level of $0.388.
Author

Manish Chhetri
FXStreet
Manish Chhetri is a crypto specialist with over four years of experience in the cryptocurrency industry.


