Is Bitcoin's next stop $75.000? Head and shoulders pattern signals danger ahead

Check our previous analysis: 'Did Bitcoin top out at $1,08,367? Critical levels to watch' to understand the larger picture and how the current scenario unfolds.
Overview
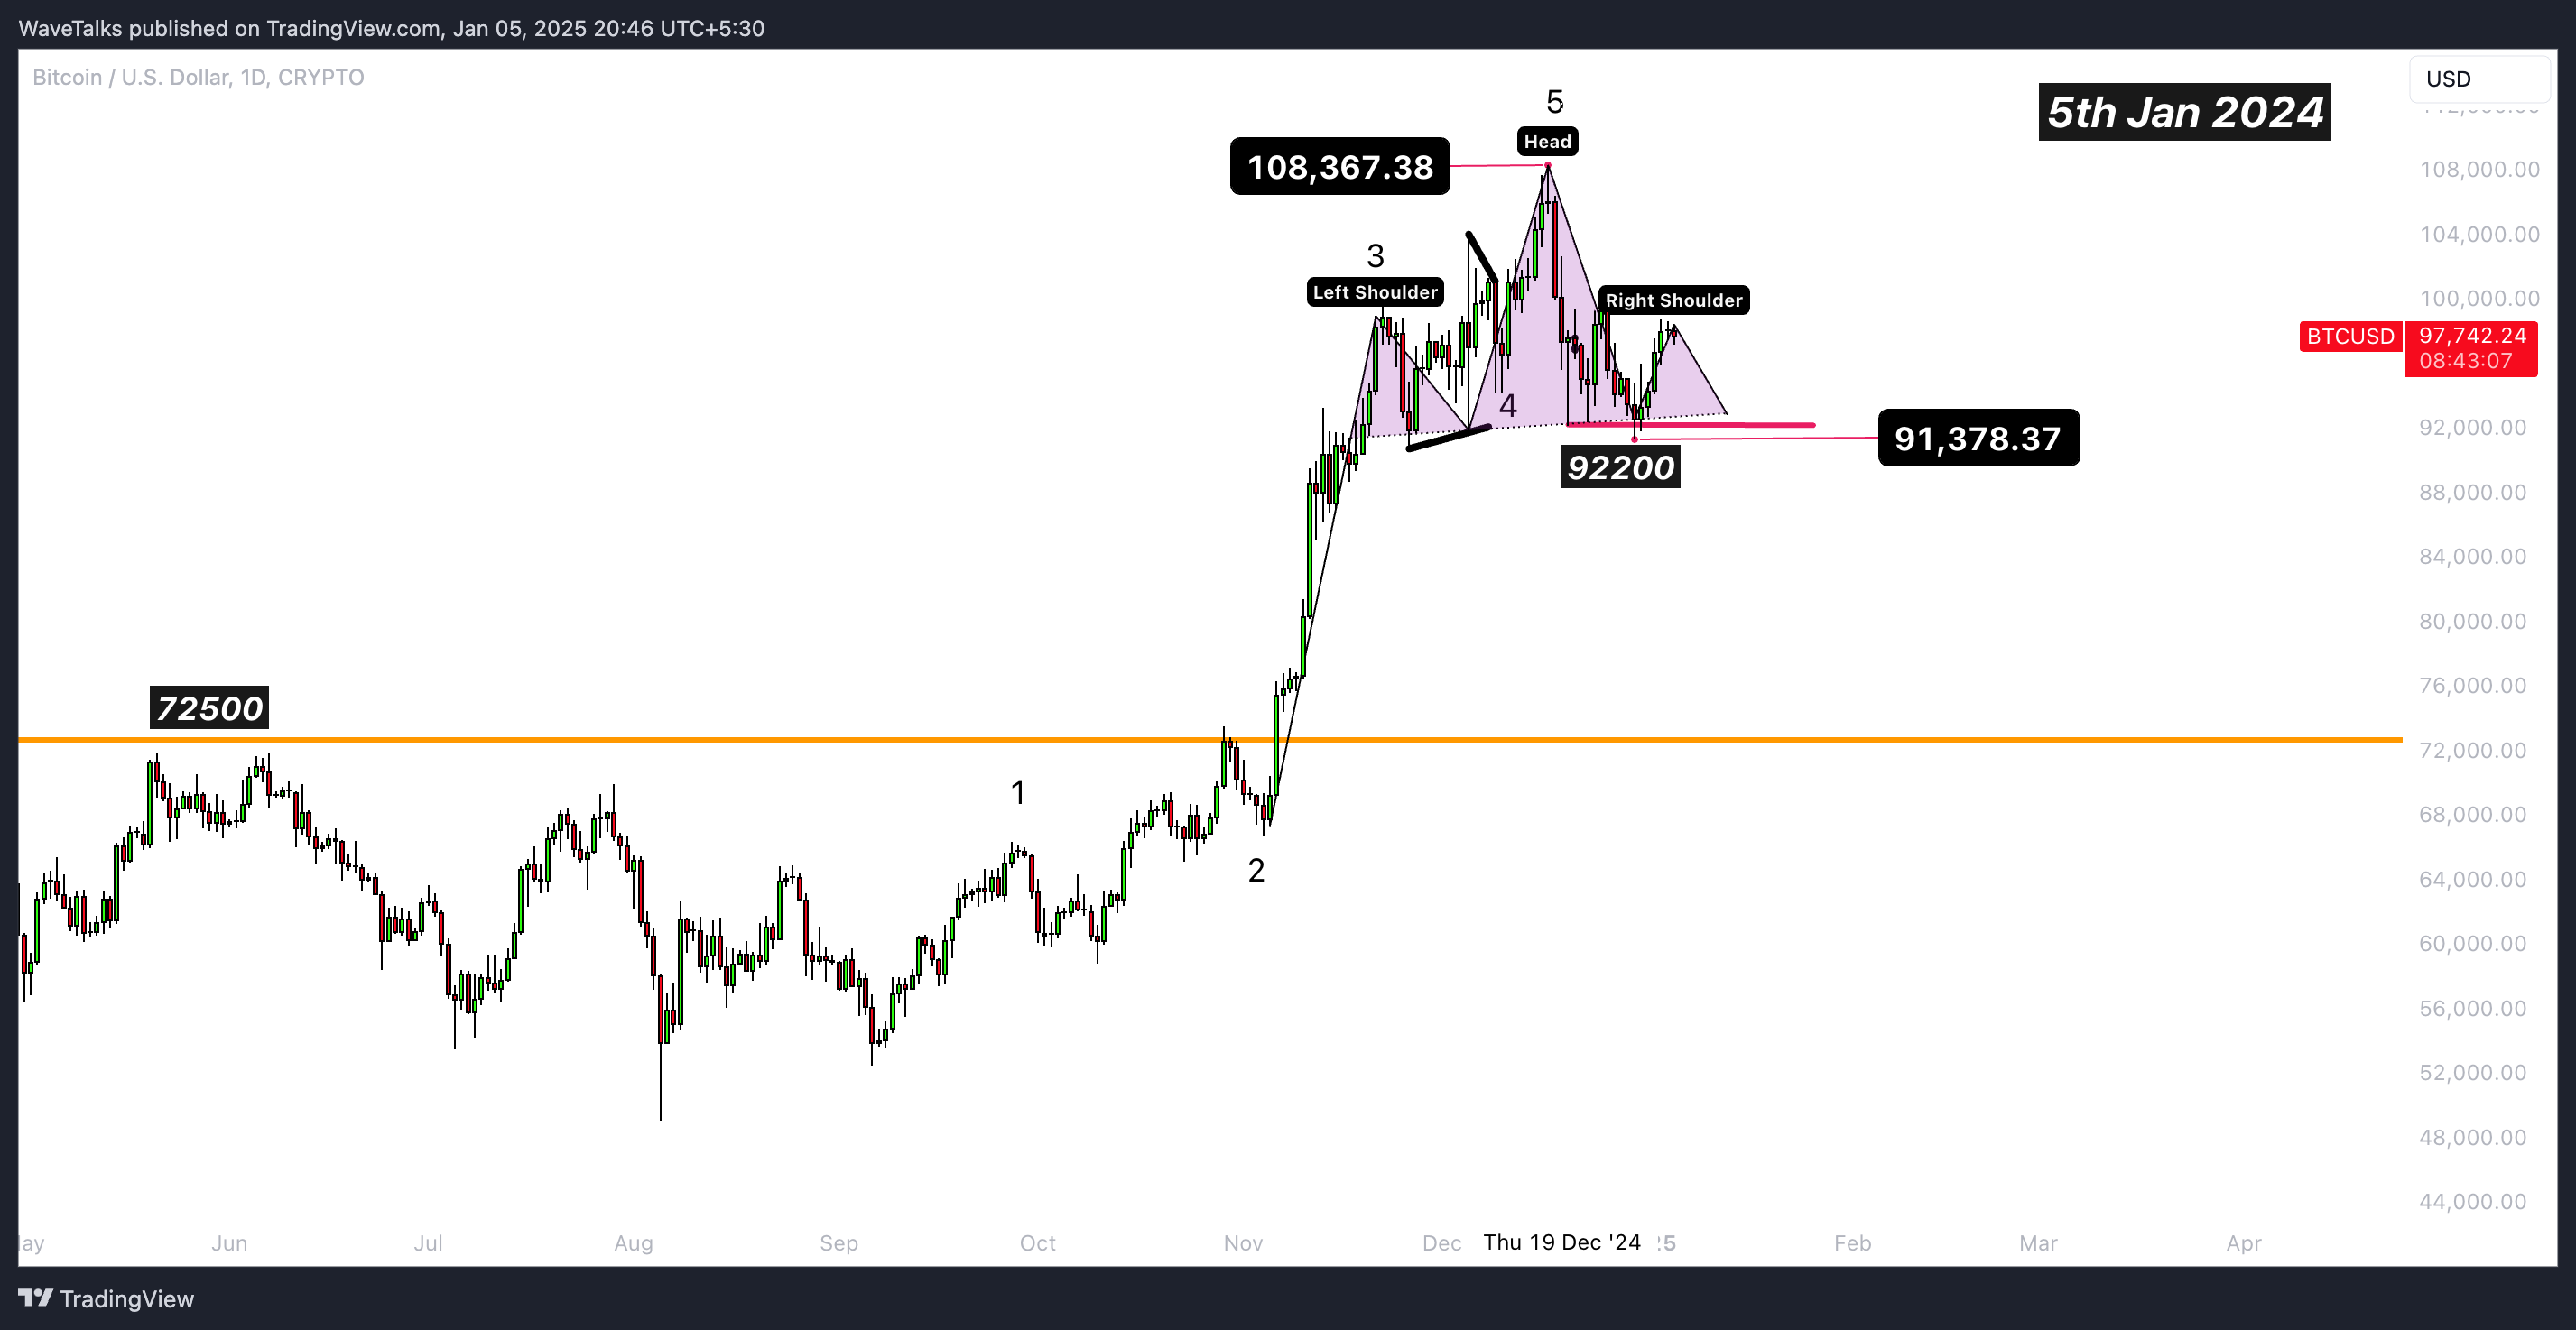
Bitcoin recently topped out at 108,367 and initially dropped to a low of 92,209, following which it entered a sideways consolidation between 99,872 and 92,200. The price briefly breached this range to make a short-term low of 91,378, then rebounded towards the 99,000 mark. Currently, Bitcoin appears to be unfolding Wave 2 as a complex correction, aligning with a classic Head & Shoulder (H&S) chart pattern.
Head and shoulder pattern analysis
-
Left shoulder: Formed near 99,662.
-
Head: At the peak of 108,367.
-
Right shoulder: Currently developing under 99,872.
The neckline for the pattern lies at approximately 92,200.
Bookish Target: Using the vertical distance from the head to the neckline (108,367 - 92,200 = 16,167), the projected downside target after breaking the neckline would be: 92,200 - 16,167 = 76,033 (approx. 75,000 zone).
Key levels to watch
-
Resistance zones:
-
99,000 - 100,000: Strong resistance zone.
-
Any failure to break above this will likely confirm bearish momentum.
-
-
Support levels:
-
91,378 (recent low): A decisive break below this will validate the pattern.
-
85,000 - 75,000: Next logical supports if the neckline at 92,200 is breached.
-
-
Line in the sand (stop losses):
-
For bearish positions, above 100,000 invalidates bearish setups.
-
For bullish positions, a close below 91,378 invalidates the upward momentum.
-
Trading strategies
Bearish strategy (H&S pattern confirmation):
-
Entry: Short below 91,378, targeting the neckline breach.
-
Stop loss: Above 99,872 (right shoulder high).
-
Targets:
-
85,000 (initial support zone).
-
75,000 (H&S target).
-
Bullish strategy (breakout above 100K):
-
Entry: Long above 100,000, targeting new highs.
-
Stop loss: Below 98,500.
-
Targets:
-
105,000 - 108,000 (previous highs).
-
Extension targets based on bullish momentum.
-
Neutral approach (range play):
-
Long position:
-
Buy near 92,200 - 91,378 (neckline support).
-
Target: 98,500 - 99,000 (range resistance).
-
Stop loss: Below 90,500.
-
-
Short position:
-
Sell near 99,000 - 100,000 (resistance zone).
-
Target: 92,200 - 91,378 (range support).
-
Stop Loss: Above 100,000.
-
Expected scenario
-
If Bitcoin decisively breaks below 91,378, it would signal the activation of the Head & Shoulder pattern with potential downside towards 85,000 - 75,000.
-
If bulls reclaim 100,000, it would invalidate the bearish setup and open the door for further upside to retest 108,367 and possibly beyond.
Caution: Any rejection between 99,000 - 100,000 could be an early signal of a downside move. Be vigilant at these resistance levels.
Conclusion: The market remains highly sensitive around the 99,000 - 100,000 resistance zone and 91,378 support. Adopting a disciplined approach with stop-loss levels is essential to navigate this volatile phase effectively.
Author

Abhishek H. Singh
WaveTalks
Abhishek is a seasoned financial analyst with over a decade of experience specializing in Elliott Wave Theory.


