Sandbox bulls in control, but a pullback to $3.50 is likely
- Sandbox has rallied more than 63% from the January 22 lows.
- Bulls blasted through near-term resistance, but a retest of those breaks is likely.
- Ichimoku time cycle warns of a top appearing between today and tomorrow.

Sandbox price action has been the envy of almost every major altcoin – most certainly those altcoins involved in the metaverse and gaming token space. However, the extent of this recent rally is likely overdone and due for a corrective move test prior resistance as current support.
Sandbox price may pull back to prior resistance turned support – critical test ahead
Sandbox price shot right through three primary resistance zones in its daily chart:
- The Tenkan-Sen at $3.40.
- The bottom of a bull flag at $3.67.
- The 32.% Fibonacci retracement at $3.83.
- The Kijun-Sen at $3.92.
The most substantial evidence for an incoming retracement is the massive hidden bearish divergence between the Composite Index and the candlestick chart. Hidden bearish divergence occurs when the price chart shows peaks that are lower highs and lower closes, while the corresponding oscillator shows higher highs. It is a warning sign that the current move higher is a false one or without conviction; therefore, the prior downtrend is likely to continue.
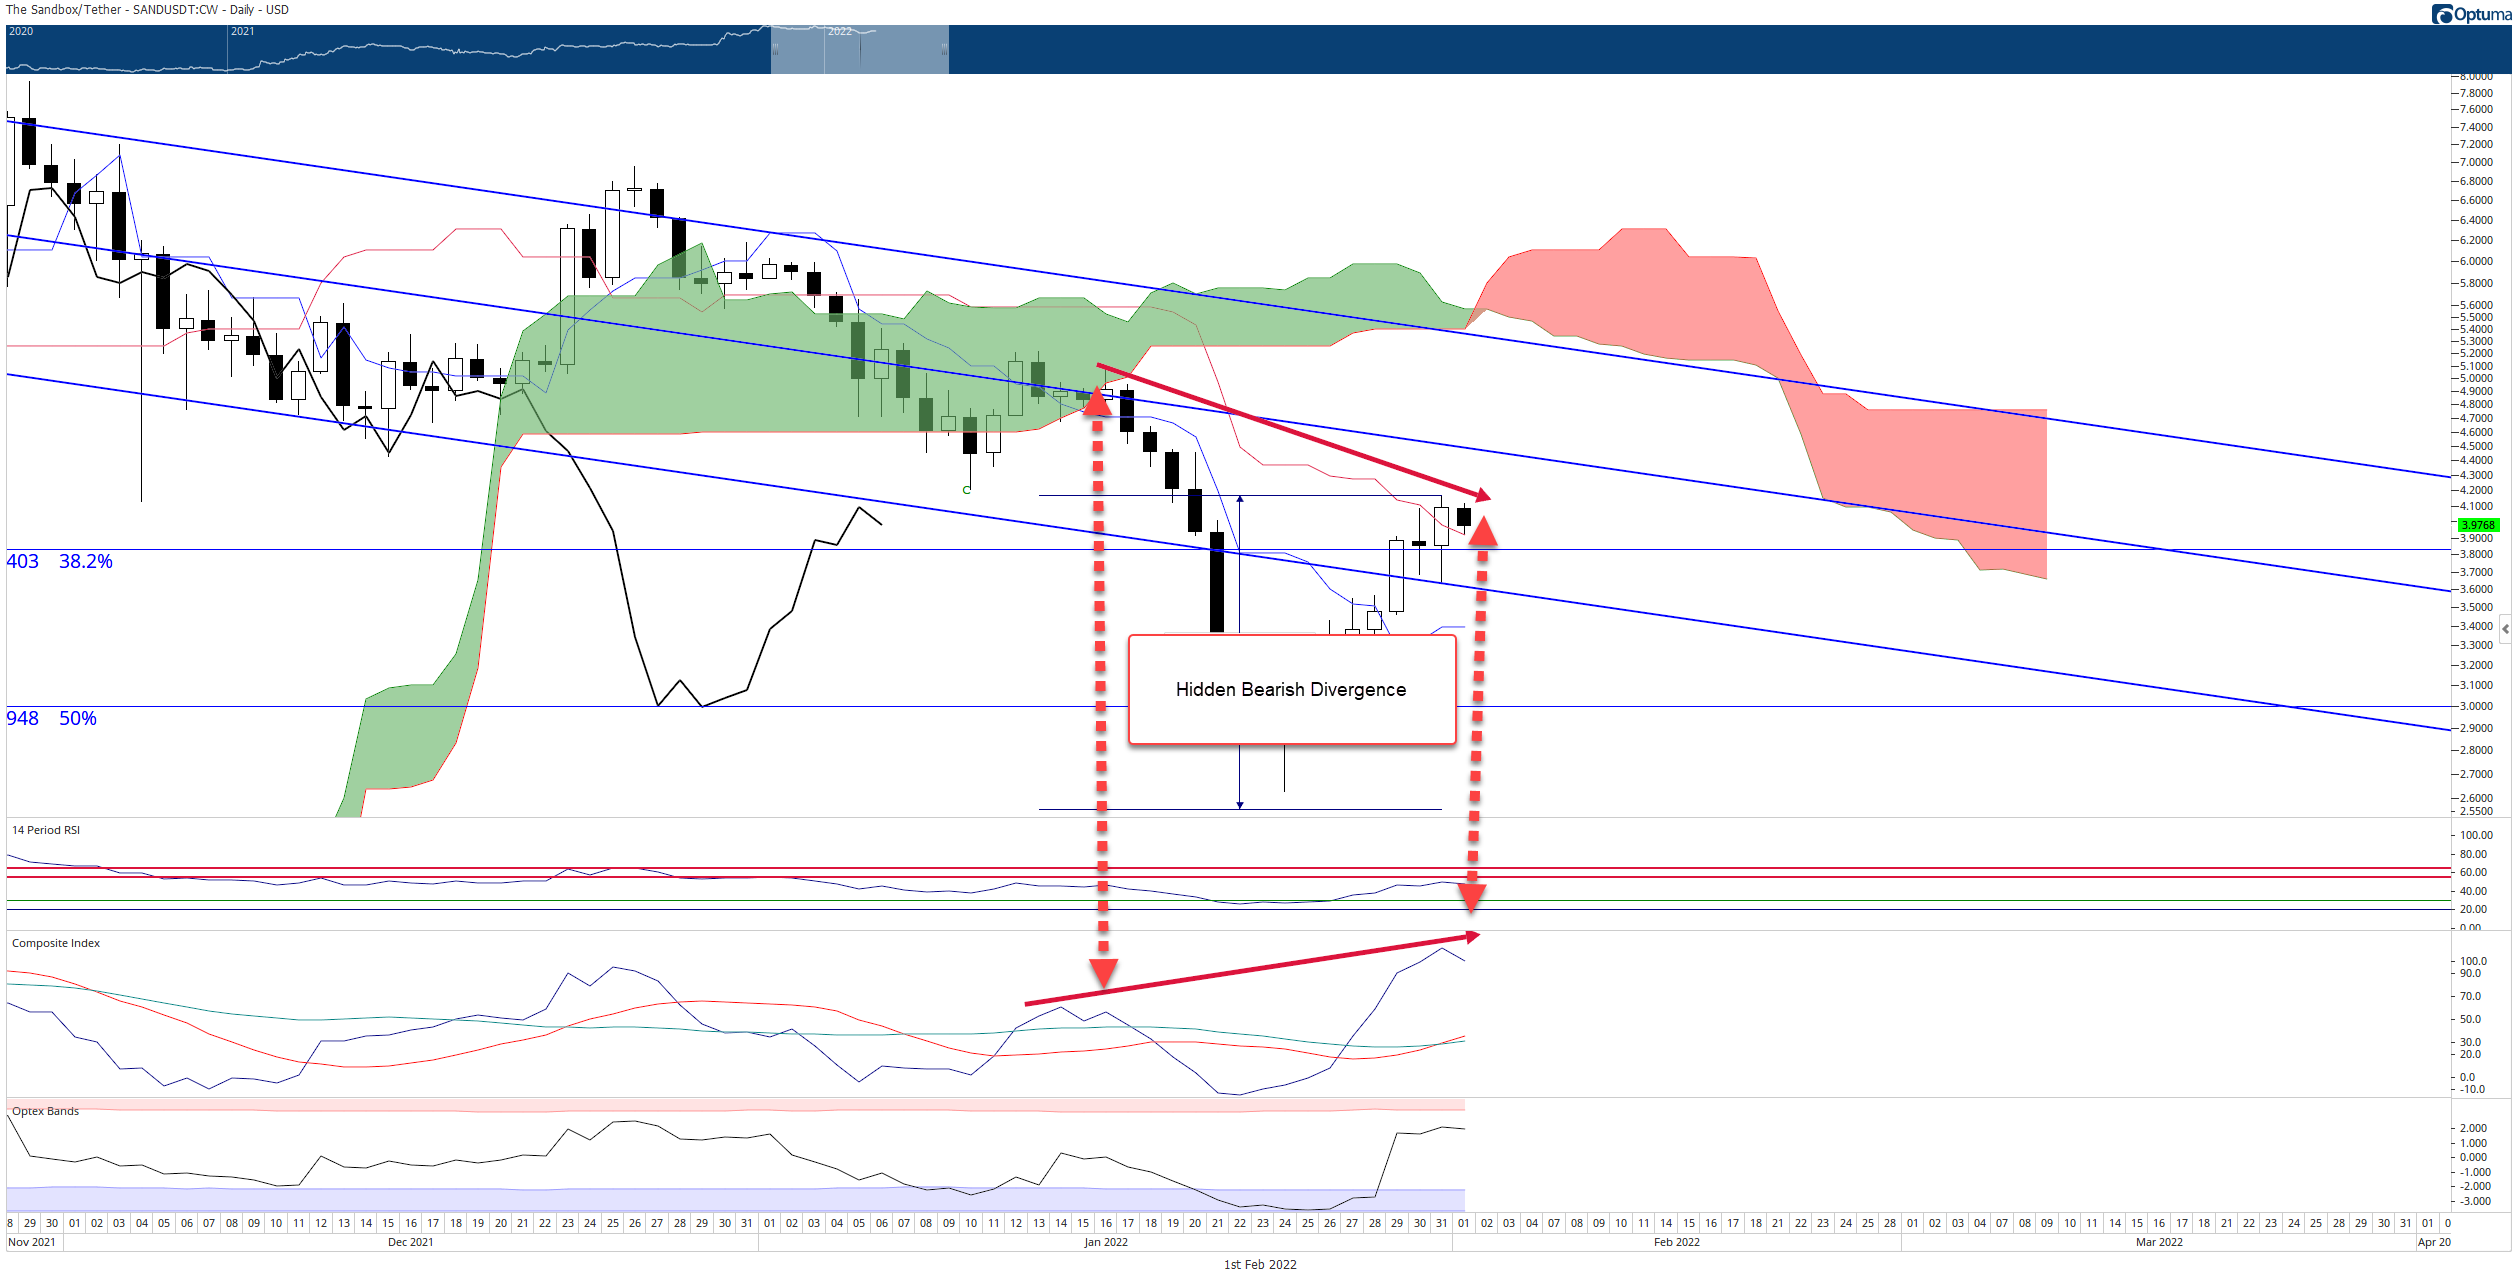
SAND/USDT Daily Ichimoku Kinko Hyo Chart
However, this hidden bearish divergence has been present for January 28 and has not resulted in any hints of bearish continuation. Therefore, if Sandbox price bulls want to stave off any retest lower, they will need to maintain a daily close above the Kijun-Sen at or above $3.94. Failure to do so will probably result in a move to test the bottom of the bull flag at $3.60.
A close above the $4.50 value area for Sandbox price would invalidate any near-term bearish corrective action for Sandbox price.
Author

Jonathan Morgan
Independent Analyst
Jonathan has been working as an Independent future, forex, and cryptocurrency trader and analyst for 8 years. He also has been writing for the past 5 years.


