SafeMoon bearish continuation pattern hints at 60% drop
- SafeMoon price consolidation continues for its fifth straight day.
- Failure to return to above the 61.8% Fibonacci retracement level at $0.0000040 will likely trigger a sell-off.
- Extreme volatility is expected.

SafeMoon price is experiencing a rare development on its daily candlesticks chart. The consolidation has lasted for five days - but every day since November 10th has been an inside bar, meaning the trading ranges have consistently developed lower highs and higher lows for five straight days. As a result, a breakout lower would likely trigger some powerful selling.
SafeMoon price is likely to remain bearish, but the long side should not be ignored
SafeMoon price has two hypothetical trade entries available – one bullish and one bearish. On the bullish side of the trade, the hypothetical entry would be a buy stop order at $0.0000040, a stop loss at $0.0000034, and a profit target at $0.0000065. Therefore, the entry would confirm a bear trap and return SafeMoon to bullish Ichimoku trading conditions.
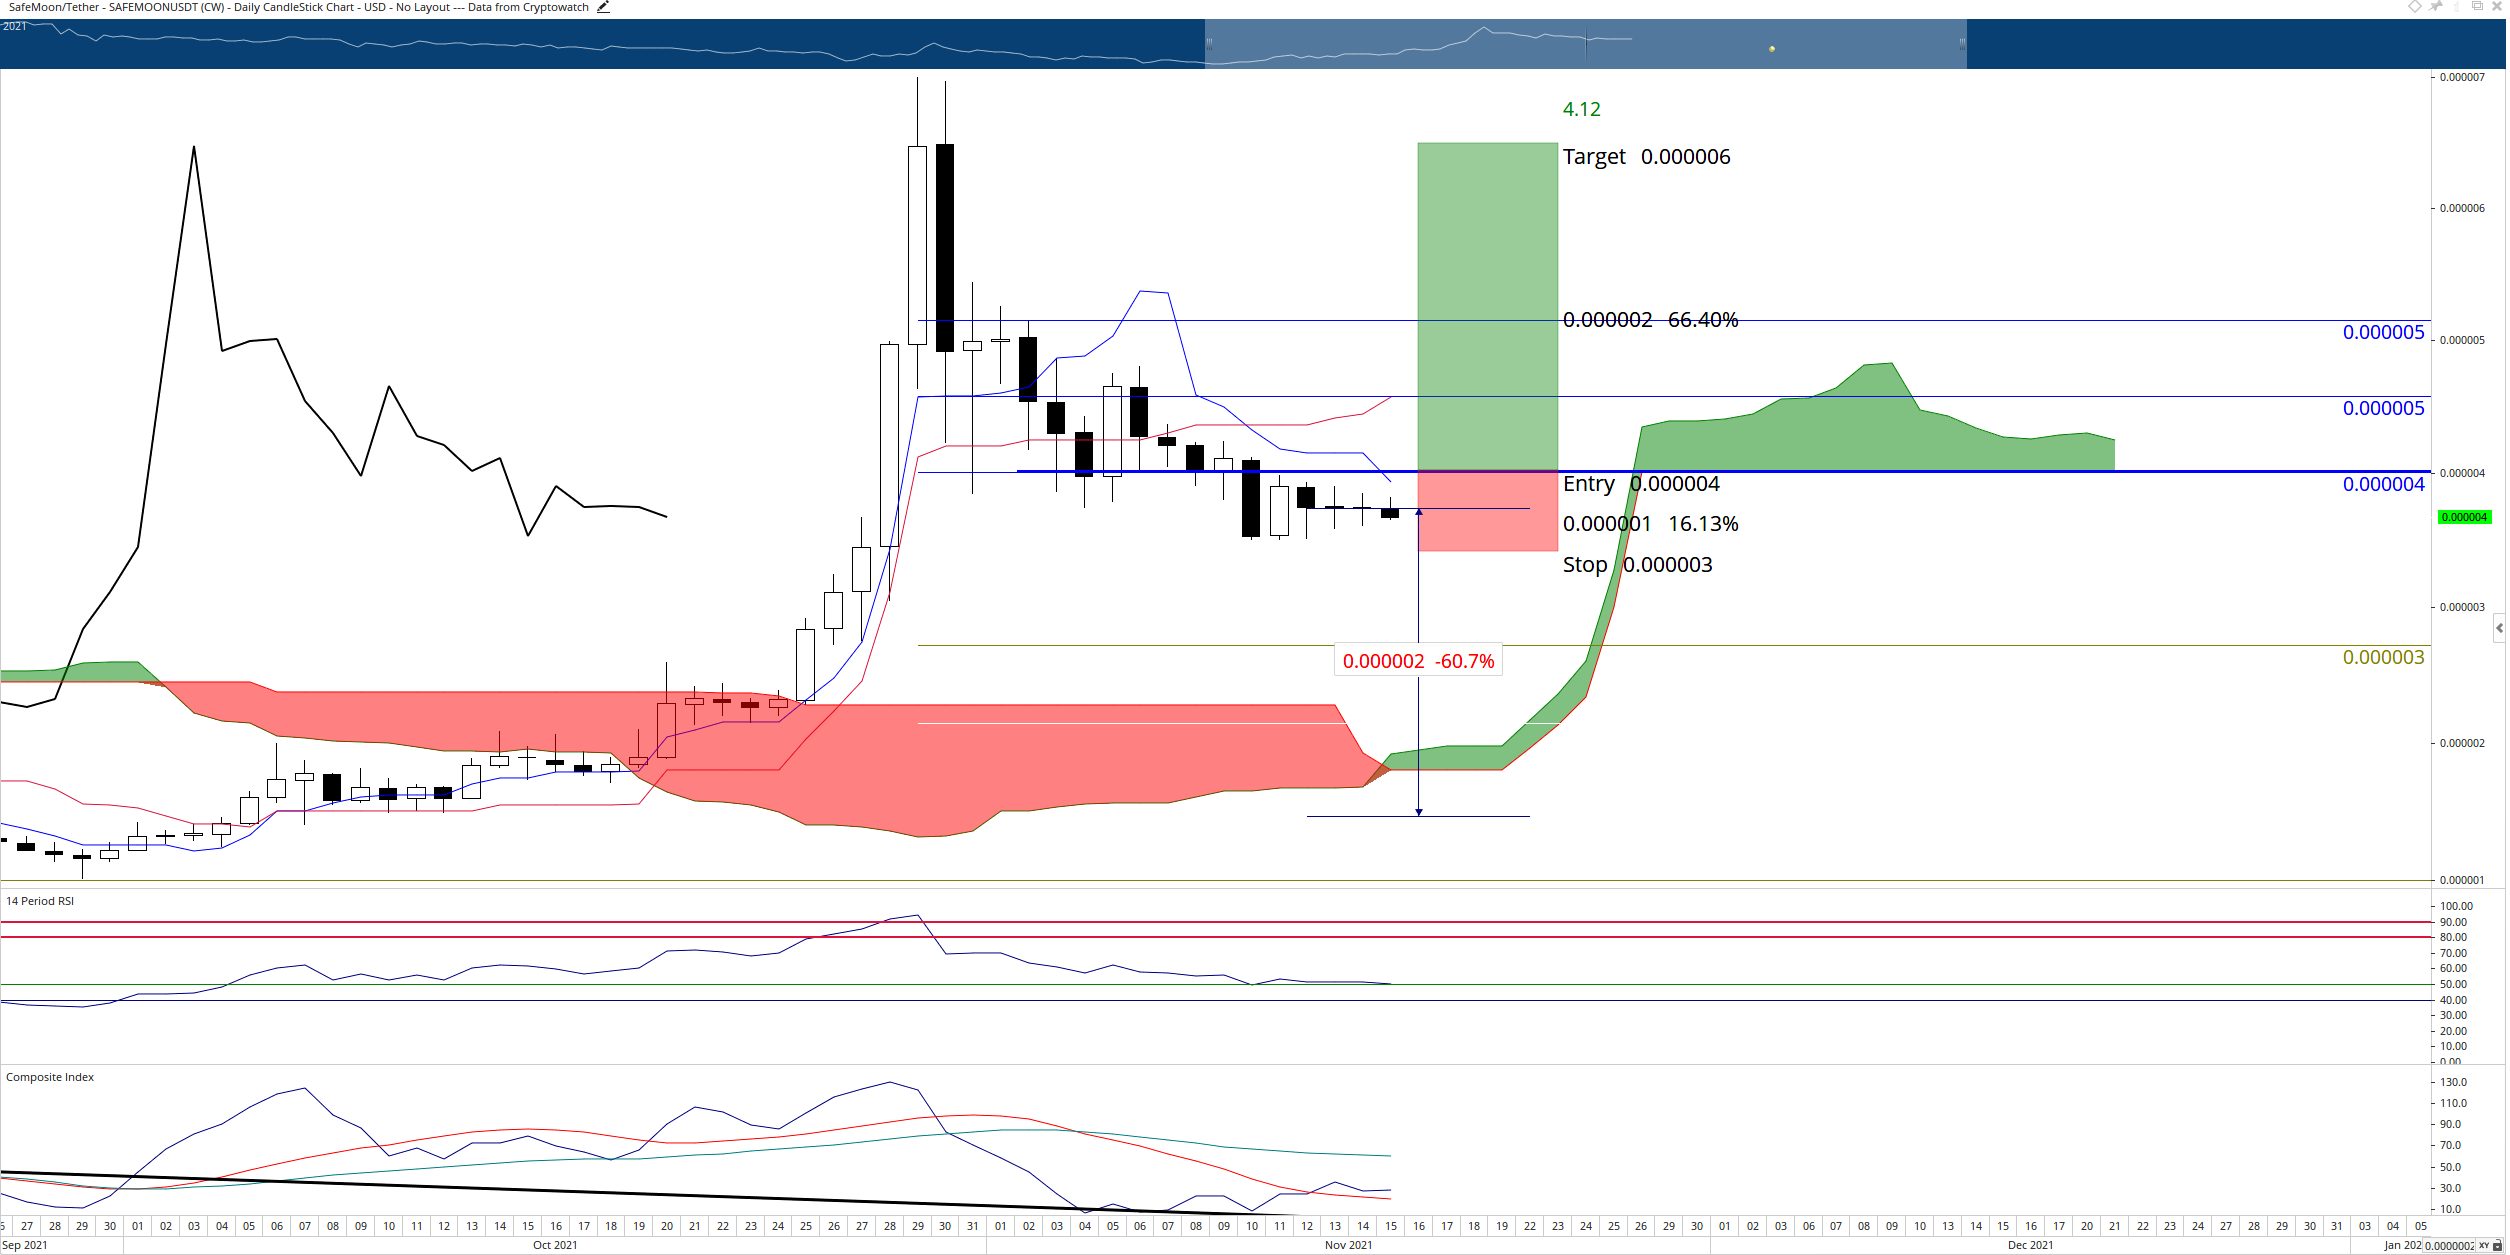
SafeMoon/USDT Daily Ichimoku Chart
The hypothetical long setup is invalidated if SafeMoon price moves below $0.0000034 before hitting the buy stop entry-level.
On the short side of the market, the theoretical entry is a sell stop order at $0.0000034, a stop loss at $0.0000040, and a profit target at $0.0000015. The short entry, if triggered, would be a breakout below the bearish pennant. Expect a large number of sell orders to trigger.
Downside risks may likely be limited to Senkou Span B – the most substantial level of support within the Ichimoku Kinko Hyo system. Consequently, SafeMoon price could see its downside risk limited to between $0.0000018 and $0.0000027 because Senkou Span B spikes up considerably between November 18th and November 26th.
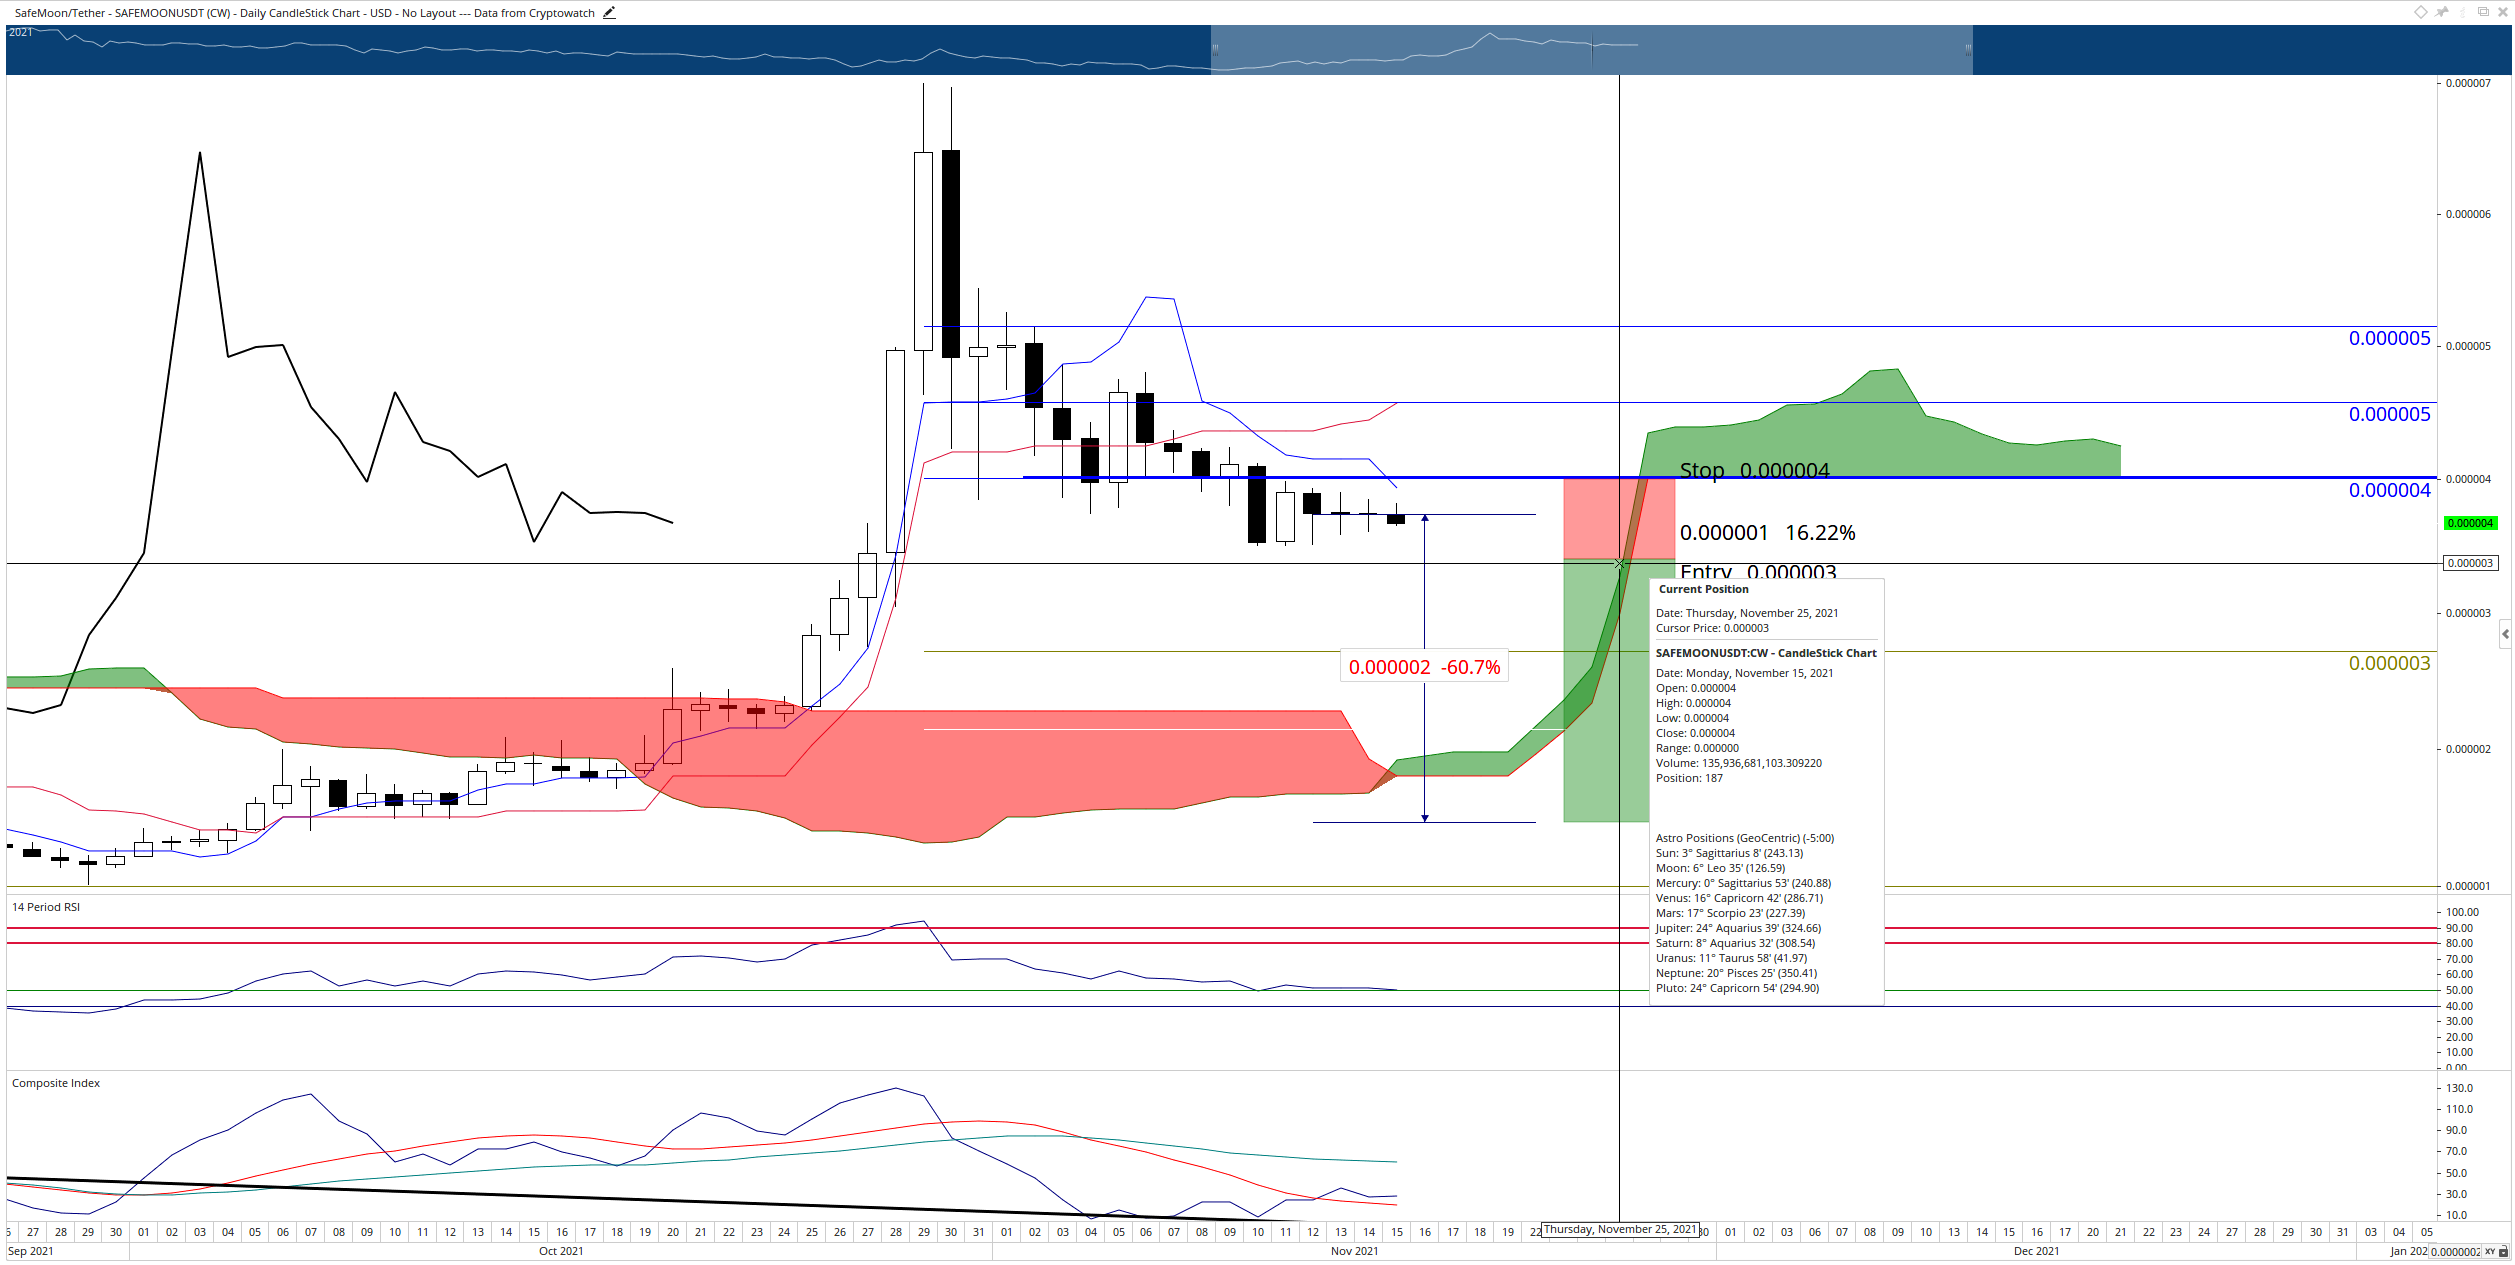
SafeMoon/USDT Daily Ichimoku Chart
The theoretical short idea is invalidated if SafeMoon price moves to $0.0000040 before the entry is triggered.
Author

Jonathan Morgan
Independent Analyst
Jonathan has been working as an Independent future, forex, and cryptocurrency trader and analyst for 8 years. He also has been writing for the past 5 years.
More from Jonathan Morgan


