- Safemoon price is in the second week of price correction.
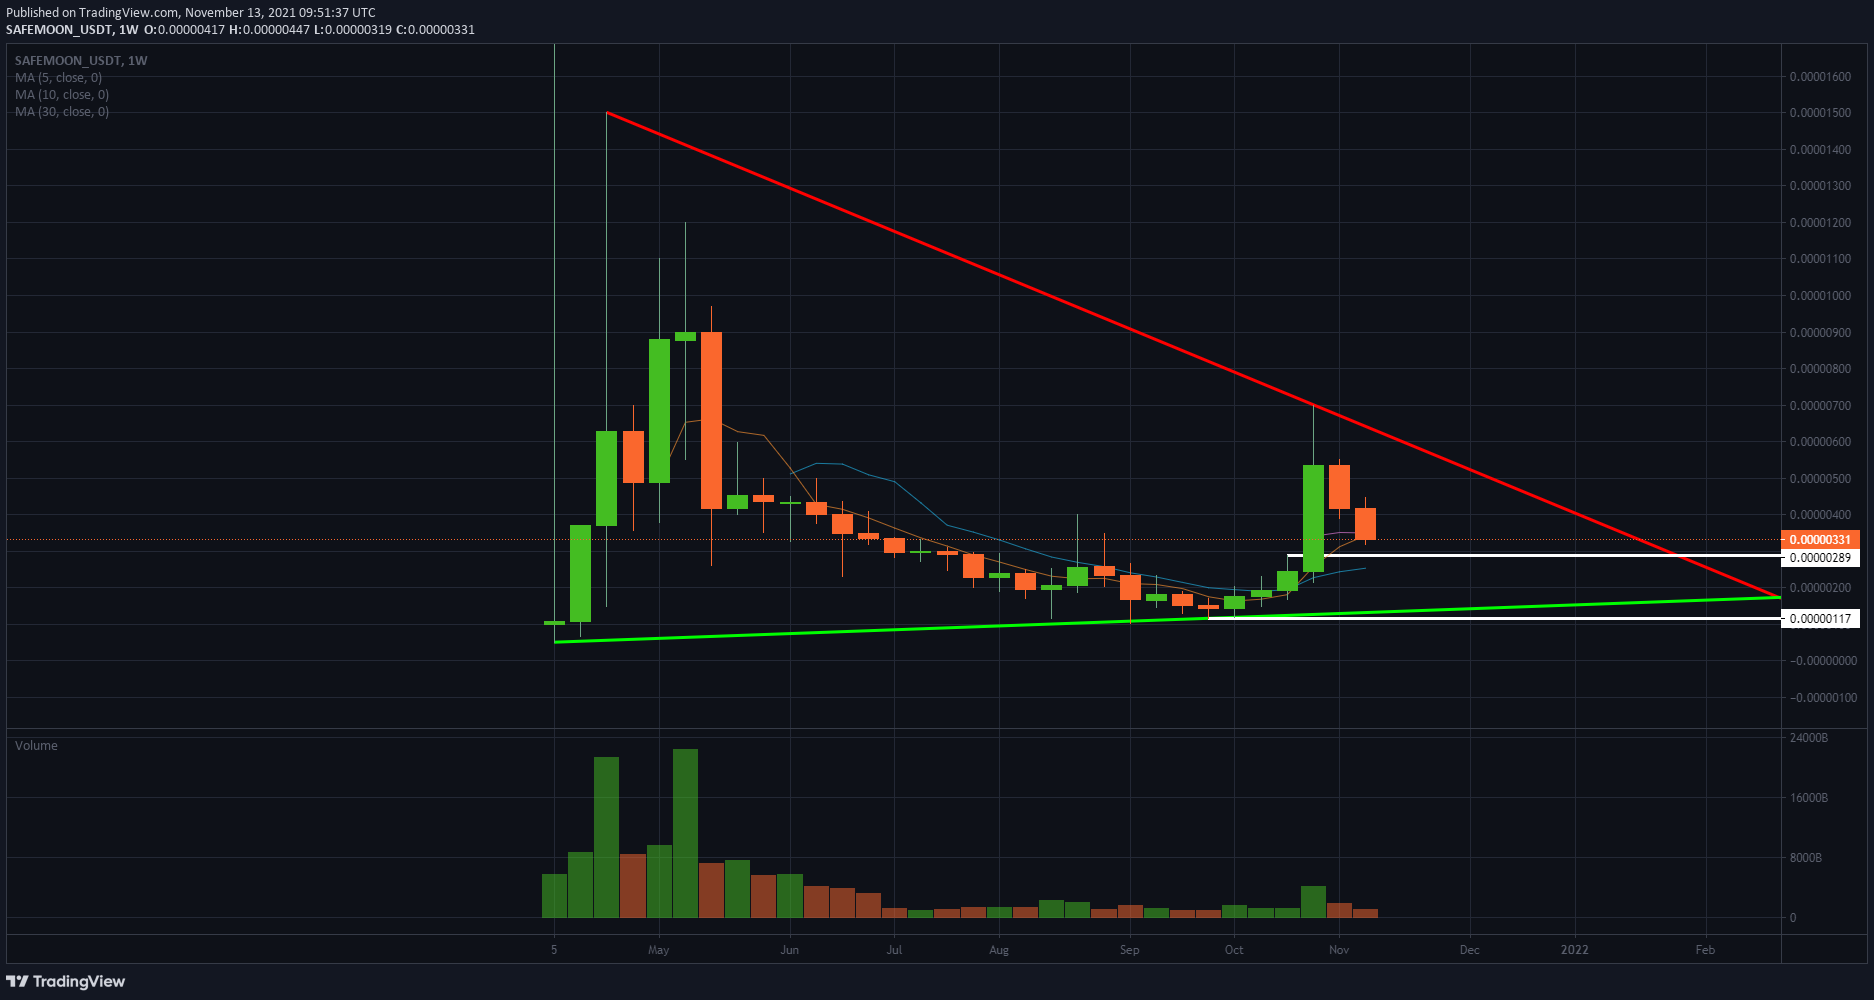
- Safemoon price almost wholly reversed the bullish breakout from October.
- With support at $0.00000289, expect a bounce and a new breakout to come.
Safemoon (SAFEMOON) price is stuck in a sharp correction following the initial nose dive last week after breaking the high of June. Safemoon price sees bears pushing Safemoon price further downwards, almost but fully reversing the gains. Support is coming in at $0.00000289 and could potentially trigger a new breakout like three weeks ago.
Safemoon price sees bulls waiting a fitting moment for the next breakout
Safemoon price hit $0.00000700 at the end of October before the price reversed quite rapidly. This week proved to be no other, and the gains from October are almost entirely paired back. With that said, bulls will be gearing up for another breakout as the breakout proves that profits are there and bears are not that insignificant presence as since May and the whole summer throughout. Support at $0.00000289, coming from the beginning of October, looks promising and will undoubtedly see a slowdown or even a halt for the bearish candle next week, as bulls will undoubtedly want to buy in the opportunity again.
Safemoon price will see bulls possibly going for the fade-in trade if $0.00000289 does not hold that firm enough, with the green ascending trend line and $0.00000117 as two close support elements. As bulls will have averaged in on these levels, expect a breakout towards the red descending trend line around $0.00000600. When Safemoon price sees bulls break that red trend line, expect more buyers to flock in, and price action could shoot higher towards $0.00001200, which would be a 300% return.
Safemoon/USD weekly chart
If Safemoon would fall back into its same regime as during past summer, expect a break below $0.00000289. As support turns into resistance, Safemoon price could stay muted below that level and get caught in a squeeze between the green ascending trend line and the resistance. Expect a prolonged squeeze with bulls, in the end, being able to break the $$0.00000289 resistance level and push the price back up towards $$0.00000700 for a retest and double top formation.
Information on these pages contains forward-looking statements that involve risks and uncertainties. Markets and instruments profiled on this page are for informational purposes only and should not in any way come across as a recommendation to buy or sell in these assets. You should do your own thorough research before making any investment decisions. FXStreet does not in any way guarantee that this information is free from mistakes, errors, or material misstatements. It also does not guarantee that this information is of a timely nature. Investing in Open Markets involves a great deal of risk, including the loss of all or a portion of your investment, as well as emotional distress. All risks, losses and costs associated with investing, including total loss of principal, are your responsibility. The views and opinions expressed in this article are those of the authors and do not necessarily reflect the official policy or position of FXStreet nor its advertisers. The author will not be held responsible for information that is found at the end of links posted on this page.
If not otherwise explicitly mentioned in the body of the article, at the time of writing, the author has no position in any stock mentioned in this article and no business relationship with any company mentioned. The author has not received compensation for writing this article, other than from FXStreet.
FXStreet and the author do not provide personalized recommendations. The author makes no representations as to the accuracy, completeness, or suitability of this information. FXStreet and the author will not be liable for any errors, omissions or any losses, injuries or damages arising from this information and its display or use. Errors and omissions excepted.
The author and FXStreet are not registered investment advisors and nothing in this article is intended to be investment advice.
Recommended Content
Editors’ Picks
Bitcoin price could retrace to $42,000 if US Nonfarm Payroll comes in at 180,000

Bitcoin price just like other assets, is highly impacted by the macro-financial developments. This includes the Nonfarm Payrolls (NFP) report released by the BLS of the United States. This time around, the NFP data is expected to cause a dip in the value of BTC.
Ripple is now only 3% away from becoming a bigger entity than Binance Coin
Ripple has overcome a lot of obstacles on its way to becoming the world’s fifth-largest cryptocurrency, as witnessed by the recent rise in XRP price. The native token of the world’s biggest crypto exchange, Binance Coin, on the other hand, has been moving in the opposite direction.
Ethereum leads altcoins north as Bitcoin halts amid bull trap fears

Ethereum (ETH) price remains northbound, unrelenting despite the king of cryptocurrency, Bitcoin, showing weakness. Behavior analytics tool Santiment observes that Ether and altcoins are on a tear even as BTC momentum fades.
BTC headstrong as Spot ETF talks reach technical stage

Bitcoin remains steadfast on the higher timeframe, amid news that spot BTC exchange-traded funds (ETF) discussions are now at the technical stage of approval. Specifically, talks with Spot BTC ETF issuers have advanced to key technical details, with Reuters indicating that it could signal a shift toward a potential approval.
Bitcoin Weekly Forecast: BTC uptrend capped by supply barrier at $43,860 as FOMO fails to suffice

Bitcoin (BTC) price uptrend has sustained since mid-September on the weekly timeframe but has since slowed down following the lack of tailwinds to drive the market. All along, narratives, themes and speculation were the driving factors, inspiring a wave of fear of missing out (FOMO) in the market. As it turns out, FOMO is not enough anymore.