Ripple's XRP Technical Analysis: XRP/USD vulnerable to further downside
- Ripple's XRP on Thursday is taking a beating, nursing losses of almost 4% in the session.
- XRP/USD price behaviour suggests price remains vulnerable to further potential downside.

XRP/USD 15-minute chart
- Near-term bearish pennant pattern eyed via the 15-minute chart view, subject to potential breakout south.
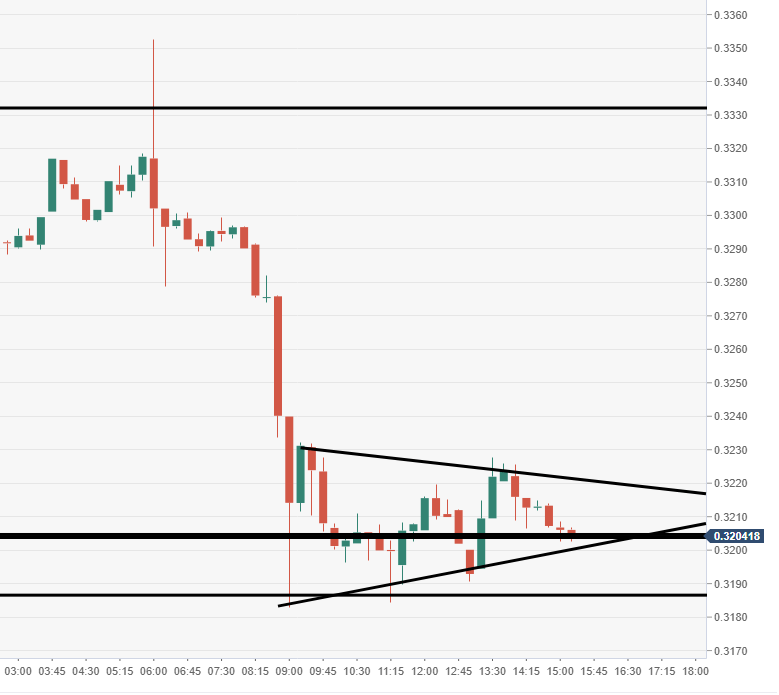
Spot rate: 0.3205
Relative change: -3.75%
High: 0.3352
Low: 0.3183
Trend: Bearish
Trends:
Daily SMA20: 0.3071
Daily SMA50: 0.3227
Daily SMA100: 0.3503
Daily SMA200: 0.3794
Levels:
Previous Daily High: 0.3373
Previous Daily Low: 0.3207
Previous Weekly High: 0.3136
Previous Weekly Low: 0.2971
Previous Monthly High: 0.3906
Previous Monthly Low: 0.2833
Daily Fibonacci 38.2%: 0.3309
Daily Fibonacci 61.8%: 0.327
Daily Pivot Point S1: 0.3235
Daily Pivot Point S2: 0.3138
Daily Pivot Point S3: 0.3069
Daily Pivot Point R1: 0.34
Daily Pivot Point R2: 0.3469
Daily Pivot Point R3: 0.3566
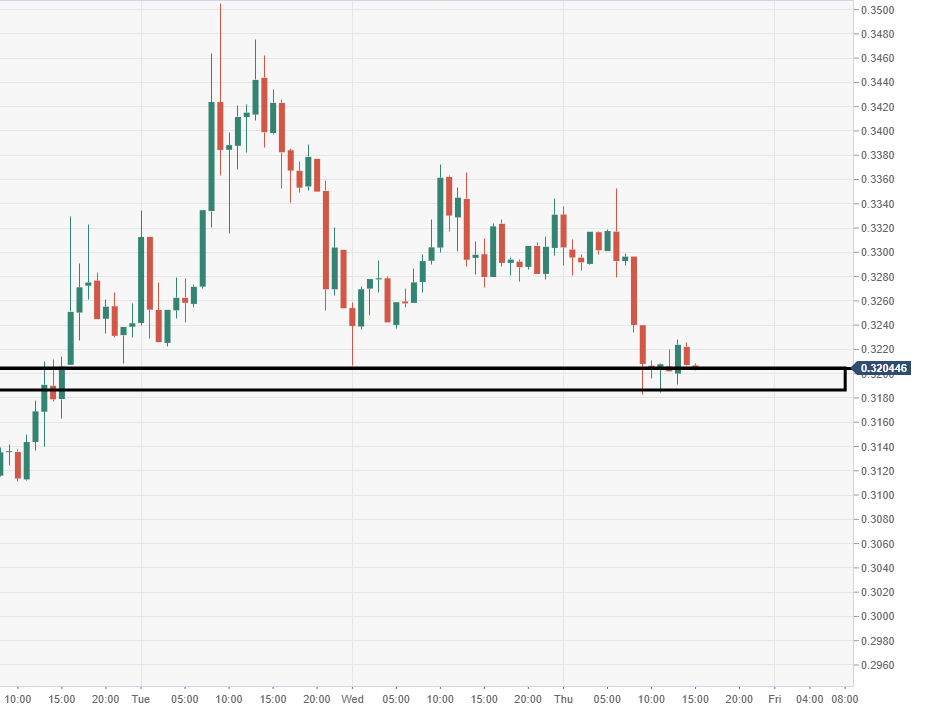
XRP/USD 60-minute chart
- Near-term demand area noted around $0.3200-0.3185 range, a range could open door to a wave of selling pressure.
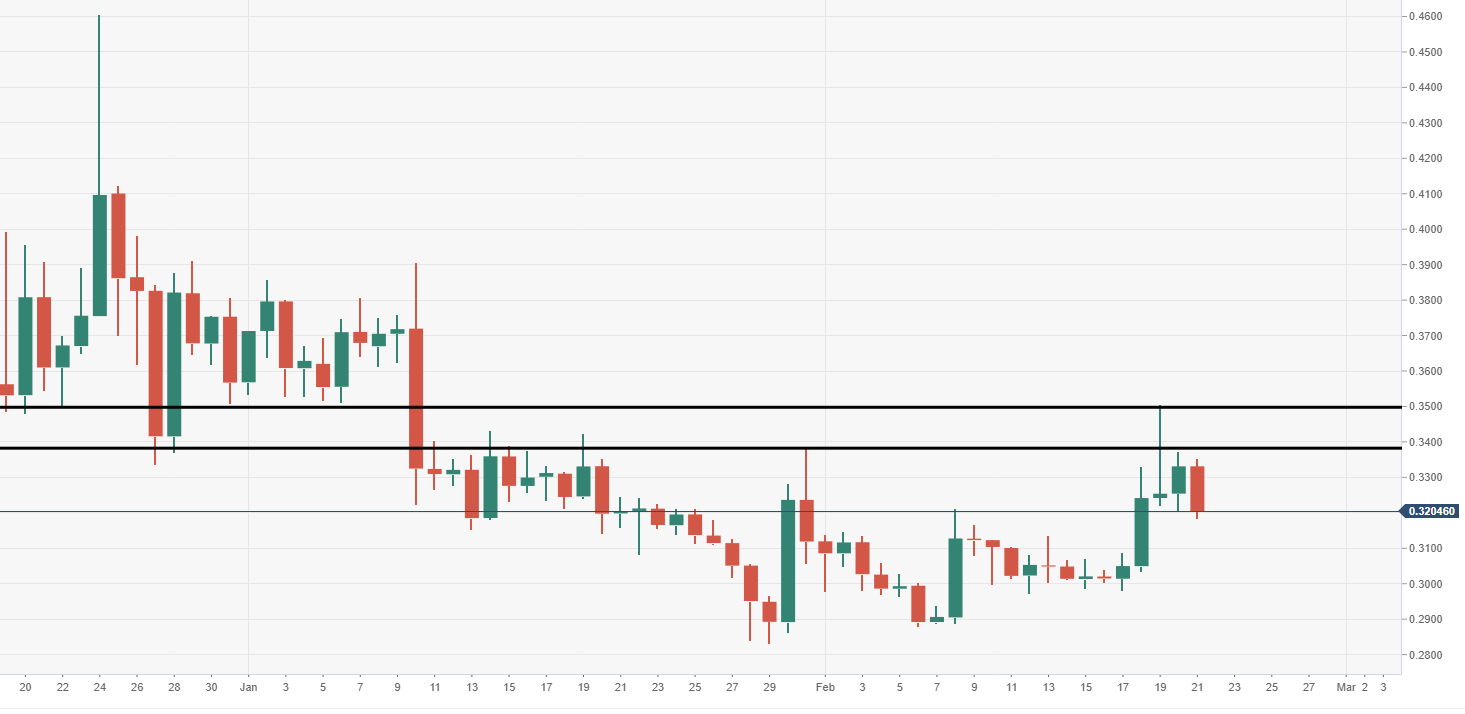
XRP/USD daily chart
- Daily supply running into the $0.3500 remains very much strong and intact, bull not having enough momentum to breakout.
Author

Ken Chigbo
Independent Analyst
Ken has over 8 years exposure to the financial markets. He started his career as an analyst, covering a variety of asset classes; forex, fixed income, commodities and equities.


