|

Ripple's XRP Technical Analysis: XRP/USD vital game-changing support is being tested to the downside

  • Ripple's XRP price returned under pressure on Monday, nursing losses of 0.80% at the start of the week. 
  • XRP/USD sees a critical daily ascending trend line supporting the price, preventing the sellers piling in. 
  • The bulls cannot progress unless the chunky area of supply is broken down from $0.3400-0.3600 range. 

Spot rate:                 0.31190

Relative change:      -0.80%

High:                         0.3160

Low:                          0.3091

Trends:
    Daily SMA20: 0.3185
    Daily SMA50: 0.312
    Daily SMA100: 0.3282
    Daily SMA200: 0.3778
Levels:
    Previous Daily High: 0.32
    Previous Daily Low: 0.311
    Previous Weekly High: 0.3236
    Previous Weekly Low: 0.3011
    Previous Monthly High: 0.3505
    Previous Monthly Low: 0.2879
    Daily Fibonacci 38.2%: 0.3144
    Daily Fibonacci 61.8%: 0.3166
    Daily Pivot Point S1: 0.3105
    Daily Pivot Point S2: 0.3063
    Daily Pivot Point S3: 0.3015
    Daily Pivot Point R1: 0.3195
    Daily Pivot Point R2: 0.3242
    Daily Pivot Point R3: 0.3284

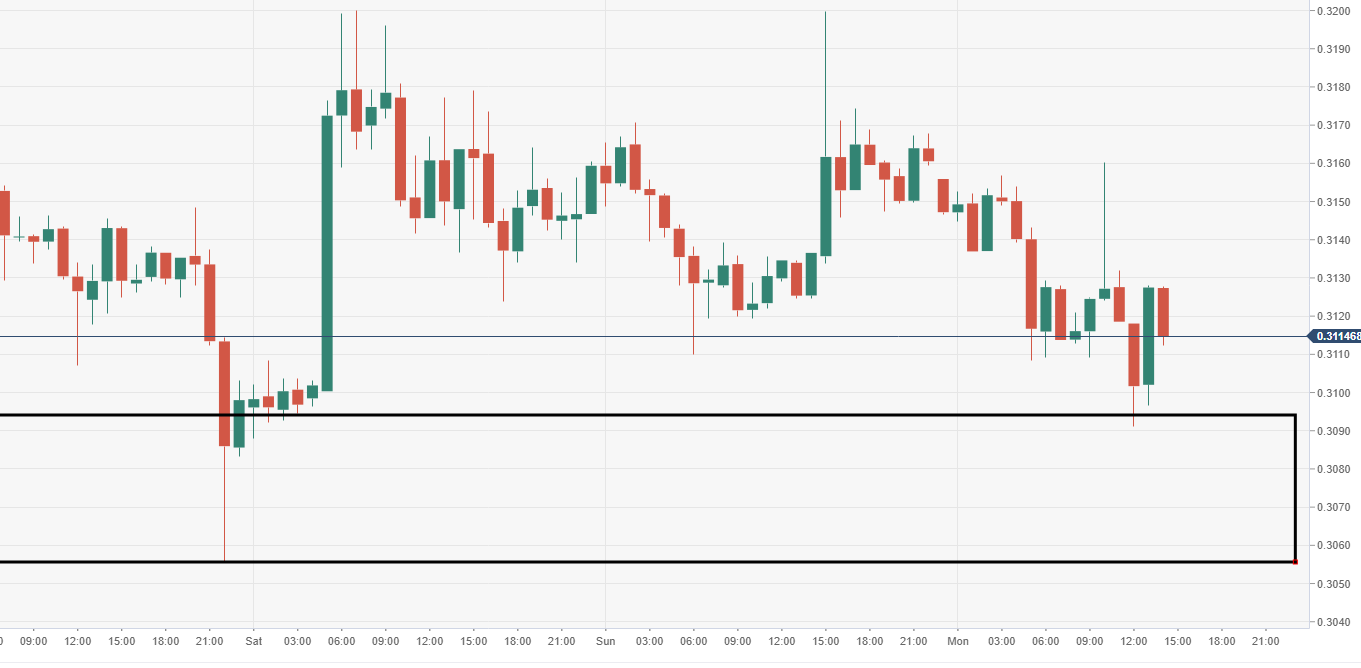
XRP/USD 60-minute chart

  • Big near-term buying area around the $0.3050 level continues to prevent the price from free-falling.
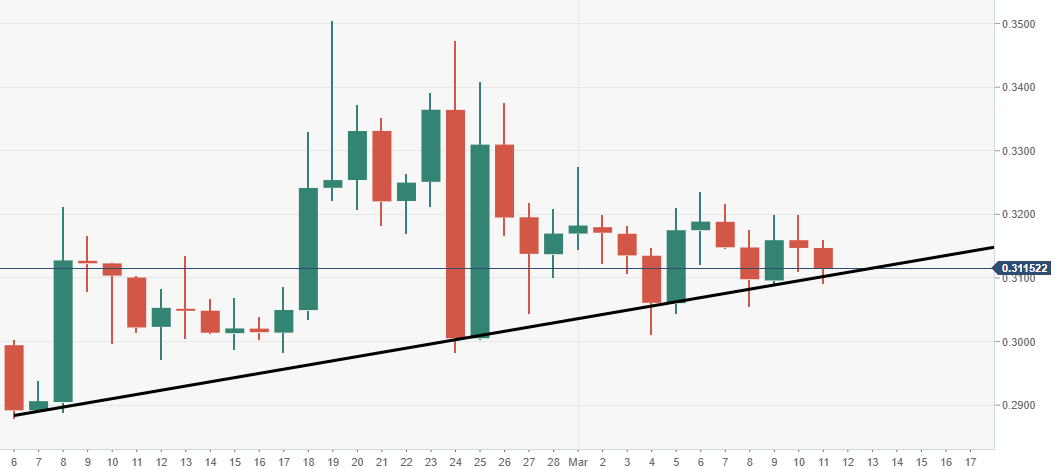
XRP/USD daily chart

  • A vital daily ascending trend line is providing critical support for XRP/USD. 

Author

Ken Chigbo

Ken Chigbo

Independent Analyst

Ken has over 8 years exposure to the financial markets. He started his career as an analyst, covering a variety of asset classes; forex, fixed income, commodities and equities.

More from Ken Chigbo
Share:

Editor's Picks

Ripple bulls defend key support amid waning retail demand and ETF inflows

XRP ticks up above $1.40 support, but waning retail demand suggests caution. XRP attracts $4 million in spot ETF inflows on Thursday, signaling renewed institutional investor interest.

Crypto Today: Bitcoin, Ethereum, XRP rebound as risk appetite improves

Bitcoin rises marginally, nearing the immediate resistance of $68,000 at the time of writing on Friday. Major altcoins, including Ethereum and Ripple, hold key support levels as bulls aim to maintain marginal intraday gains.

Bitcoin Weekly Forecast: No recovery in sight 

Bitcoin price continues to trade sideways between $65,729 and $71,746, extending its consolidation since February 7. US-spot ETFs record an outflow of $403.90 million through Thursday, pointing to the fifth consecutive week of withdrawals.

Pi Network Price Forecast: PI recovery stalls amid profit-taking

Pi Network tests 50-day EMA support on Friday, after a 5% decline the previous day. PiScan data shows large deposits on CEXs totaling over 4 million PI tokens in the last 24 hours, reflecting an exodus of investors taking profits.

Bitcoin Price Annual Forecast: BTC holds long-term bullish structure heading into 2026

Bitcoin (BTC) is wrapping up 2025 as one of its most eventful years, defined by unprecedented institutional participation, major regulatory developments, and extreme price volatility.

Bitcoin: No recovery in sight

Bitcoin (BTC) price continues to trade within a range-bound zone, hovering around $67,000 at the time of writing on Friday, and falling slightly so far this week, with no signs of recovery.