Ripple Price Analysis: XRP teasing symmetrical triangle breakdown ahead of Spark airdrop


  • XRP/USD sells the news after SPARK snapshot, ahead of the airdrop.
  • The No. 3 coin teases a symmetrical triangle breakdown on the 4H chart.
  • The path of least resistance appears to the downside.

Ripple (XRP/USD) bucks the positive trend seen across the crypto board, with ‘sell the news’ trading in play in the aftermath of Saturday’s SPARK snapshot.

The token wallows in the lower band of its recent tight trading range, as the bears fight back control in the lead up to the SPARK airdrop showdown. At the time of writing, XRP/USD sheds nearly 3.5% to trade around$ 0.5270, having recaptured the $0.50 level.

Flare Networks, a blockchain project that introduces smart contract functionality on the XRP ledger, took a snapshot of the network early Saturday and distributed SPARK tokens to all XRP holders on a one-to-one ratio. 

It’s worth noting that the number of XRP whales accumulated the XRP token and sent the holdings to a new all-time high.

XRP/USD technical outlook: Poised for a downside break?

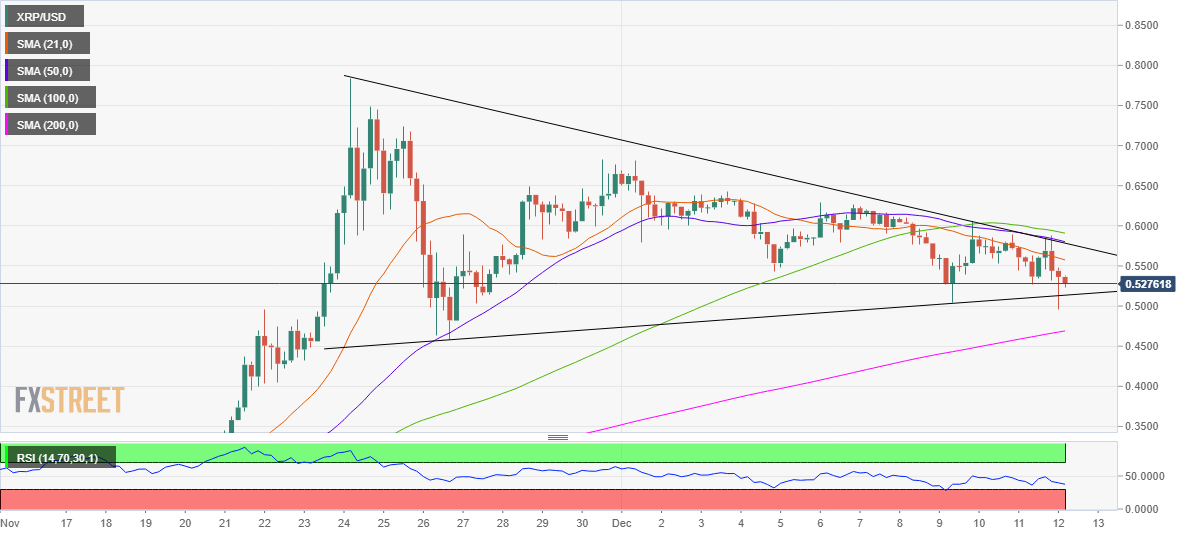
XRP/USD: Four-hour chart

Ripple is primed to dive out from the recent consolidative phase, which has taken shape of a symmetrical triangle on the four-hour (4H) chart. A downside break appears in the offing as depicted by the technical set up on the said timeframe.

XRP sellers need a four-hourly closing below the rising trendline support at $0.5135 to validate the triangle breakdown, with the immediate cushion seen at the bullish 200-simple moving average (SMA) at $0.4690.

The Relative Strength Index (RSI) inches lower towards the oversold territory, currently at 37.28, suggesting more room southwards. The next critical support awaits at $0.30.

Alternatively, acceptance above the critical resistance at $0.5800 could open doors towards a retest of multi-year tops of $0.7843. Ahead of that, an immediate 100-SMA barrier at $.5908 could come into play.

XRP/USD: Additional levels to consider

XRP/USD

Overview
Today last price 0.5274
Today Daily Change -0.0165
Today Daily Change % -3.03
Today daily open 0.5439
 
Trends
Daily SMA20 0.5942
Daily SMA50 0.3975
Daily SMA100 0.321
Daily SMA200 0.2747
 
Levels
Previous Daily High 0.5883
Previous Daily Low 0.5265
Previous Weekly High 0.6289
Previous Weekly Low 0.504
Previous Monthly High 0.7843
Previous Monthly Low 0.228
Daily Fibonacci 38.2% 0.5501
Daily Fibonacci 61.8% 0.5647
Daily Pivot Point S1 0.5176
Daily Pivot Point S2 0.4912
Daily Pivot Point S3 0.4558
Daily Pivot Point R1 0.5793
Daily Pivot Point R2 0.6147
Daily Pivot Point R3 0.6411


Information on these pages contains forward-looking statements that involve risks and uncertainties. Markets and instruments profiled on this page are for informational purposes only and should not in any way come across as a recommendation to buy or sell in these assets. You should do your own thorough research before making any investment decisions. FXStreet does not in any way guarantee that this information is free from mistakes, errors, or material misstatements. It also does not guarantee that this information is of a timely nature. Investing in Open Markets involves a great deal of risk, including the loss of all or a portion of your investment, as well as emotional distress. All risks, losses and costs associated with investing, including total loss of principal, are your responsibility. The views and opinions expressed in this article are those of the authors and do not necessarily reflect the official policy or position of FXStreet nor its advertisers. The author will not be held responsible for information that is found at the end of links posted on this page.

If not otherwise explicitly mentioned in the body of the article, at the time of writing, the author has no position in any stock mentioned in this article and no business relationship with any company mentioned. The author has not received compensation for writing this article, other than from FXStreet.

FXStreet and the author do not provide personalized recommendations. The author makes no representations as to the accuracy, completeness, or suitability of this information. FXStreet and the author will not be liable for any errors, omissions or any losses, injuries or damages arising from this information and its display or use. Errors and omissions excepted.

The author and FXStreet are not registered investment advisors and nothing in this article is intended to be investment advice.

Join Telegram

Recommended content


Recommended Content

Editors’ Picks

LINK price jumps 10% as Chainlink races toward tokenization of funds

LINK price jumps 10% as Chainlink races toward tokenization of funds

Chainlink (LINK) price has remained range-bound for a while, stuck between the $16.00 roadblock to the upside and $13.08 to the downside. However, in light of recent revelations, the token, which powers the verifiable web of the decentralized computing platform, may have further upside potential.

More Chainlink News

Gaming token Notcoin down by almost 50% after airdrop launch

Gaming token Notcoin down by almost 50% after airdrop launch

NOT experienced a rapid decline hours after its anticipated launch on Thursday, shedding almost 50% of its value. This continues the cycle of huge selling pressure faced by cryptocurrency airdrops after their launch, especially the launch of gaming tokens in recent times.

More Notcoin News

Ethereum drops below $3,000 again, spot ETH ETF sparks debate in crypto community

Ethereum drops below $3,000 again, spot ETH ETF sparks debate in crypto community

Ethereum again went below the $3,000 key level on Thursday after posting signs of a rally. The price action follows predictions from the community regarding the SEC's decision on spot ETH ETFs next week.

More Ethereum News

SUI price defends $0.8880 amid multiple Sui network integrations

SUI price defends $0.8880 amid multiple Sui network integrations

Sui (SUI) price failed to heed to the broader market recovery on Wednesday, extending the fall to the $0.8880 support level. However, with multiple network integrations in the works, the altcoin has pivoted around this level and is scaling a recovery.

More Sui News

Bitcoin: Why BTC is close to a bottom

Bitcoin: Why BTC is close to a bottom

Bitcoin (BTC) price efforts of a recovery this week have been countered by selling pressure during the onset of the American session. However, the downside potential appears to have been capped. 

Read full analysis

BTC

ETH

XRP