|

Ripple Elliott Wave technical analysis [Video]

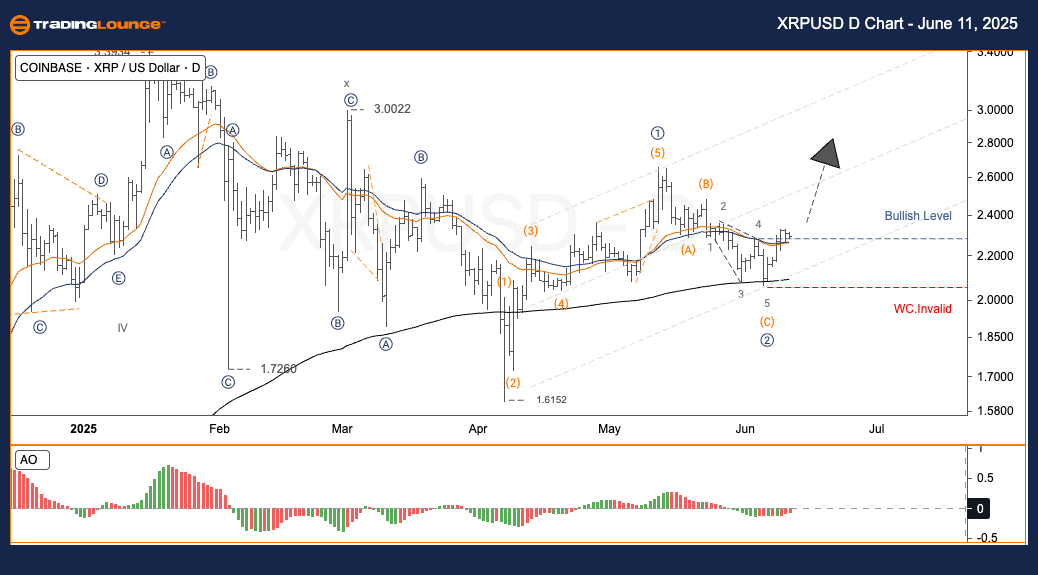
Ripple Elliott Wave analysis – Daily chart

  • Function: Follow Trend.

  • Mode: Motive.

  • Structure: Impulse.

  • Position: Wave 3.

  • Direction next higher degrees:

  • Wave cancel invalid level:

XRP/USD trading strategy

After a long correction phase in wave (2) from April, XRP recently delivered a bullish reversal. The price has broken above the $2.30 bullish level, signaling the potential start of wave (3).

This formation not only confirms the end of the Zigzag correction of wave (2), but also presents a buying opportunity for traders anticipating the correction's conclusion.

Trading strategies

  • Strategy

    • Short-Term Traders (Swing Trade): Consider entering when price moves past the bullish level and consolidates briefly.

  • Risk management

    • Stop-loss: Set below $2.05.

Chart

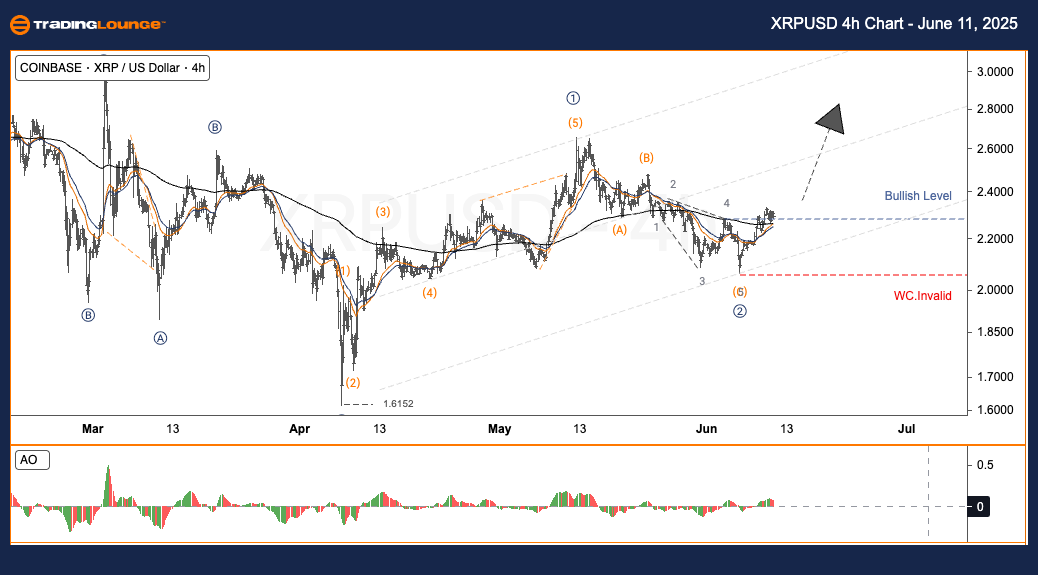
 XRP/USD Elliott Wave technical analysis – Four-hour chart

  • Function: Follow Trend.

  • Mode: Motive.

  • Structure: Impulse.

  • Position: Wave 3.

  • Direction next higher degrees:

  • Wave cancel invalid level:

XRPUSD trading strategy

XRP has regained upward momentum after pausing in wave (2) since April. A break above the bullish level of approximately $2.30 confirms wave (3) may be in progress.

The structure implies wave (2) completed as a Zigzag, presenting a buying opportunity for traders who waited for this signal.

Trading strategies

  • Strategy

    • Short-term traders (swing trade): Look to enter following the breakout and consolidation.

  • Risk management

    • Stop-loss: Place below $2.05.

Chart

Ripple Elliott Wave technical analysis [Video]

Author

Peter Mathers

Peter Mathers

TradingLounge

Peter Mathers started actively trading in 1982. He began his career at Hoei and Shoin, a Japanese futures trading company.

More from Peter Mathers
Share:

Editor's Picks

Bitcoin Cash trades lower, risks dead-cat bounce amid bearish signals

Bitcoin Cash (BCH) trades in the red below $522 at the time of writing on Tuesday, after multiple rejections at key resistance. BCH’s derivatives and on-chain indicators point to growing bearish sentiment and raise the risk of a dead-cat bounce toward lower support levels.

Pump.fun Price Forecast: PUMP weakens amid 10 billion token unlock, low retail interest

Pump.fun (PUMP) edges lower by roughly 2% at the time of writing on Tuesday, extending Monday’s 4% drop. The launchpad token remains at downside risk as 10 billion PUMP will unlock on Tuesday, while retail interest is declining.

Hyperliquid Price Forecast: HYPE consolidates as traders show mixed sentiment

Hyperliquid (HYPE) price is trading sideways at the time of writing on Tuesday, reflecting market indecision as traders await a clearer directional signal. The derivatives data further supports this mixed sentiment, with rising short bets while funding rates remain positive. 

Top Crypto Gainers: World Liberty Financial, MemeCore and Quant gain momentum

World Liberty Financial, MemeCore, and Quant are leading gains over the last 24 hours as the broader cryptocurrency market stabilizes after last week’s correction. Still, the technical outlook for altcoins remains mixed due to prevailing downside pressure and vulnerable market sentiment. 

Bitcoin Price Annual Forecast: BTC holds long-term bullish structure heading into 2026

Bitcoin (BTC) is wrapping up 2025 as one of its most eventful years, defined by unprecedented institutional participation, major regulatory developments, and extreme price volatility.

Bitcoin: The worst may be behind us

Bitcoin (BTC) price recovers slightly, trading at $65,000 at the time of writing on Friday, after reaching a low of $60,000 during the early Asian trading session. The Crypto King remained under pressure so far this week, posting three consecutive weeks of losses exceeding 30%.