- Polygon price dips sharply during ASIA PAC as dollar strength erases positive sentiment.
- MATIC price sees investors worrying about earnings and more Chinese lockdowns to come.
- Expect a further drop to the downside with no FED officials present to provide support or guidance.
Polygon (MATIC) price is set to drop 12% as price fades further under the scrutiny of dollar strength and investors worrying about Covid spreading in Beijing and Shanghai. Not only is that last element a worry – that lockdowns can swing back into effect in Europe and the US – but it also adds to pressure again on the already troubled supply chains, potentially resulting in higher inflation. With that correlation, investors are pulling more funds out of equities and cryptocurrencies and fleeing into cash and safe havens this morning. This is causing a drop in MATIC price towards $1.20 and possibly lower going into the trading week as big tech is set to report its earnings.
MATIC price sees one tail risk being replaced by six others
Polygon price was expected to see bulls storming out of the gates on Monday as Macron secured another term, and with that, more support for the euro and the eurozone should have translated into the markets. But instead, investors quickly replaced the tail risk of the French elections, with six other tail risks. These included rising Covid cases in Asia and earnings from Microsoft, Alphabet, Meta, Apple and Amazon all out this week. With Netflix already triggering a massive sell-off and restraints for equity markets, expect one alarm signal from one of these five to trigger another massive sell-off. Nasdaq is the most prominent victim, triggering a spillover to cryptocurrencies.
MATIC price is thus far from out of the woods yet this week, as currently, the dollar’s strength is causing a 5% drop in ASIA PAC trading. Expect more nervous investors to join this reshuffle into the US session with MATIC price to test $1.19. Going further into the week, the price could possibly slip below $1.00 to $0.96 if $1.06 does not hold. This could come from a combination of several earnings warnings or higher prices due to persistent inflation, which could trigger a 30% nosedive.
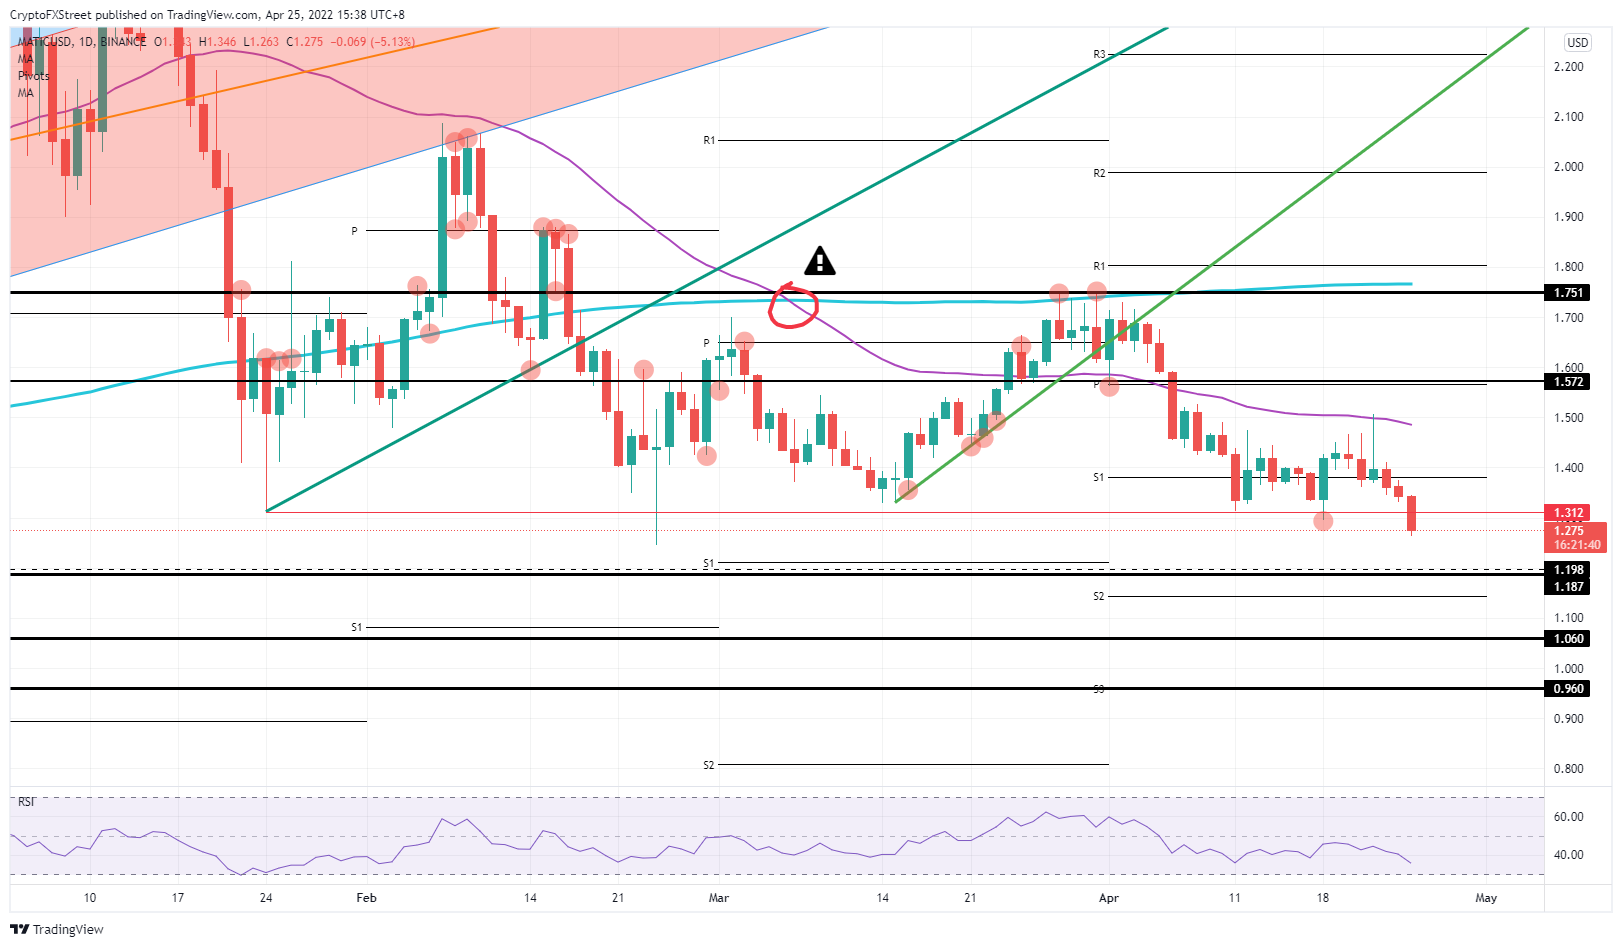
MATIC/USD daily chart
Any support will be more than welcomed should, for example, earnings come out better than expected, with NASDAQ then on the front foot, and creating a mild tailwind instead. In such a scenario, MATIC price would reverse the 5% incurred current loss and possibly see an intraday close that is flat before trading higher into the week, with first $1.40 in foresight and next $1.50, with the 55-day Simple Moving Average (SMA) back in play. If investors can crackdown on the 55-day SMA, expect $1.57 to be set as a profit target, at which level a fade and profit-taking will be triggered.
Information on these pages contains forward-looking statements that involve risks and uncertainties. Markets and instruments profiled on this page are for informational purposes only and should not in any way come across as a recommendation to buy or sell in these assets. You should do your own thorough research before making any investment decisions. FXStreet does not in any way guarantee that this information is free from mistakes, errors, or material misstatements. It also does not guarantee that this information is of a timely nature. Investing in Open Markets involves a great deal of risk, including the loss of all or a portion of your investment, as well as emotional distress. All risks, losses and costs associated with investing, including total loss of principal, are your responsibility. The views and opinions expressed in this article are those of the authors and do not necessarily reflect the official policy or position of FXStreet nor its advertisers. The author will not be held responsible for information that is found at the end of links posted on this page.
If not otherwise explicitly mentioned in the body of the article, at the time of writing, the author has no position in any stock mentioned in this article and no business relationship with any company mentioned. The author has not received compensation for writing this article, other than from FXStreet.
FXStreet and the author do not provide personalized recommendations. The author makes no representations as to the accuracy, completeness, or suitability of this information. FXStreet and the author will not be liable for any errors, omissions or any losses, injuries or damages arising from this information and its display or use. Errors and omissions excepted.
The author and FXStreet are not registered investment advisors and nothing in this article is intended to be investment advice.
Recommended Content
Editors’ Picks
Ripple's move above this key level could trigger nearly 50% rally for XRP
Ripple has overcome a critical resistance level and flipped into a support floor on the weekly time frame. This development happened while XRP tightly consolidated for roughly 250 days. Investors can expect XRP to kickstart a massive rally.
Optimism price outlook with nearly $90 million worth of OP tokens flooding markets on Friday
Optimism volatility has shrunk in the ours leading to the network’s cliff unlock. It joins the likes of dYdX and Sui, which have similar events on their calendars. As token unlocks are often considered bearish catalysts, investors should brace for a reaction after the event.
Top 3 Price Prediction Bitcoin, Ethereum, Ripple: Retail watches from the sidelines with a bias for shorts
Bitcoin could clear $73,777 peak as BTC bulls resurface. Ethereum might fall 10% before next leg up as ETH RSI teases with sell signal. XRP could lose $0.6000 threshold as Ripple bulls fail to show up.
Jito price could hit $6 as JTO coils up inside this bullish pattern
Jito price action shows a potential cup and handle formation. Based on theoretical measurement rules, a successful breakout could yield a 56% rally to $6.0. A breakdown of the $3.86 support level would create a lower low for JTO and invalidate the bullish thesis.
Bitcoin: BTC may have recovered, but is it out of the woods?
Bitcoin’s (BTC) upward momentum has shown a significant decline for the past two weeks or so. This development led to a bearish signal on the weekly and an uncertain outlook on the monthly.