Polkadot price stabilization sows confidence for the short-sighted, but pattern projects further declines
- Polkadot price decline more than clearing stops and fearful pockets.
- Confirmation of double top dyes the Polkadot market red.
- DOT’s novel parachains have been a source of frenzied speculation over the last few months.

Polkadot price has failed to attack new highs with commitment and emotion since mid-February, carving out a complex top triggered during Sunday’s broad cryptocurrency meltdown. The confirmed double top raises the odds that DOT will test the March low and potentially the 61.8% Fibonacci retracement of the 2021 rally.
Polkadot price pocket leaves speculators with heightened indecision
Decentralized finance (DeFi) has been a massive catalyst of the recent bull market in cryptocurrencies, with tentacles reaching into lending, trading, financial derivatives, and insurance protocols. To put the growth in perspective, the total market value of current DeFi initiatives has grown from just $700 million at the beginning of 2020 to more than $60 billion today, and Polkadot is a leader in the space.
The market view about the role of Polkadot in the DeFi phenomenon has not changed since mid-February as the price has traded chiefly horizontally with two brief rallies into new highs in April. The resulting pattern has taken the form of a complex top culminating in a sell signal on Sunday with a break below $37.47.
Today, DOT is trading in an air pocket, below the 50-day simple moving average (SMA) at $ 37.43 and slightly above the 100-day SMA at $30.18. Due to the short-term oversold condition, the DeFi token may bounce, but the upside should be limited by the confluence of the 50-day SMA with the double top trigger at $37.47.
Support will initially be present at the 100-day SMA, followed by the March low at $27.29, which, interestingly, would trigger a second double top on the monthly chart. The following important support is the 50% retracement level of the 2021 rally at $26.86 and the February low at $25.83. If DOT does not command buying pressure around those levels, speculators should expect a test of the 61.8% retracement of the 2021 rally at $21.59.
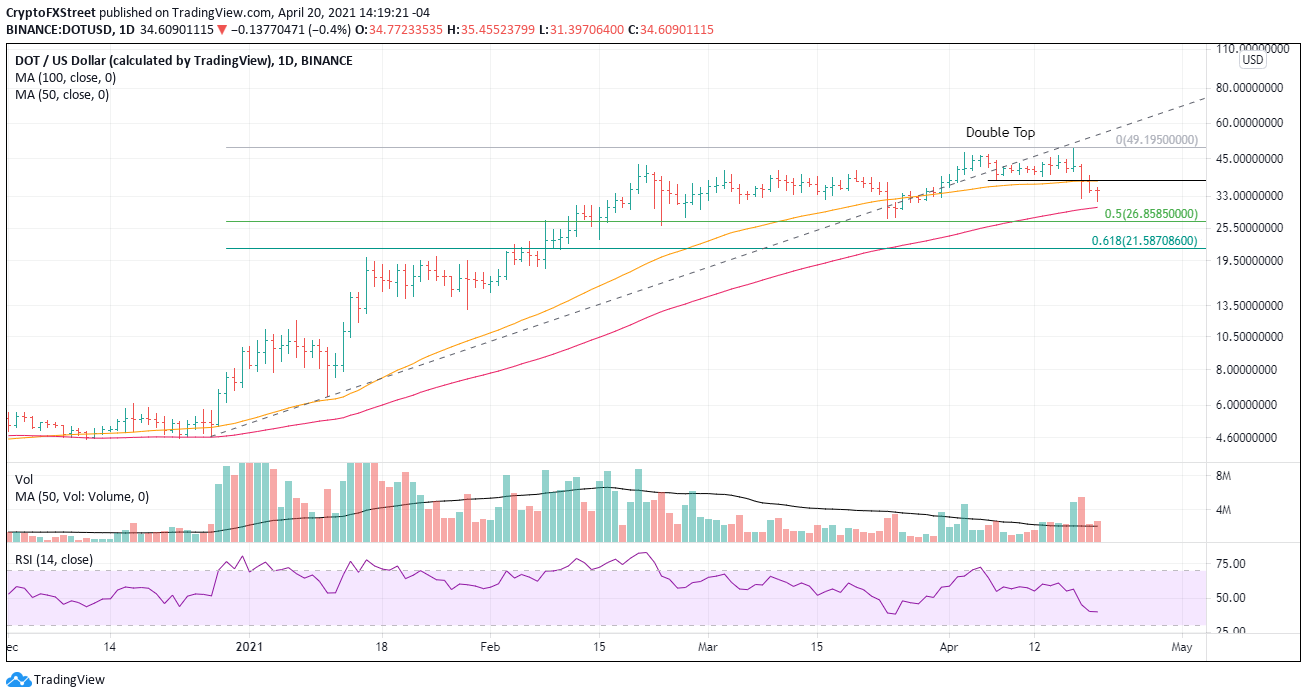
DOT/USD daily chart
As mentioned above, resistance starts with a big exclamation point at the confluence of the double bottom trigger and the flattening 50-day SMA. Even a daily close above the resistance is not a buy signal for speculators. They should wait for a daily close above $49.20. Also, they should take note of the meridian line that crosses just above $49.20. It will matter in terms of resistance.
Author

Sheldon McIntyre, CMT
Independent Analyst
Sheldon has 24 years of investment experience holding various positions in companies based in the United States and Chile. His core competencies include BRIC and G-10 equity markets, swing and position trading and technical analysis.


