Polkadot Price Prediction: DOT is getting ready to dump as technical levels flash red
- Polkadot retests early December resistance at $5.6 but stalls at $5.5.
- A double-top pattern has formed on the 4-hour chart suggesting that a reversal is imminent.
- A sell signal on the 12-hour chart seems to validate the bearish formation that could retest support at $4.8 - $5.

Polkadot pulled the uptrend a bit higher on Bitcoin's rally to new all-time highs near $22,000. The token almost recovered to the peak formed early December at $5.6. However, the price hit a barrier at $5.5. Regardless, a bearish pattern came into the picture, hinting at a gigantic correction.
Polkadot in grave danger of a massive freefall
DOT/USD seems to have formed a double-top pattern on the 4-hour chart after failing to break the resistance at $5.6. This is an extremely bearish technical reversal pattern that comes into the picture after an asset hits a high price point a couple of times. Note that there is usually a moderate price drop between the peaks.
The double-top pattern is confirmed in technical analysis when the asset dives' price under a support level that is equal to the low between the preceding two highs. Identification of a crucial support level helps to avoid failed double-top patterns.
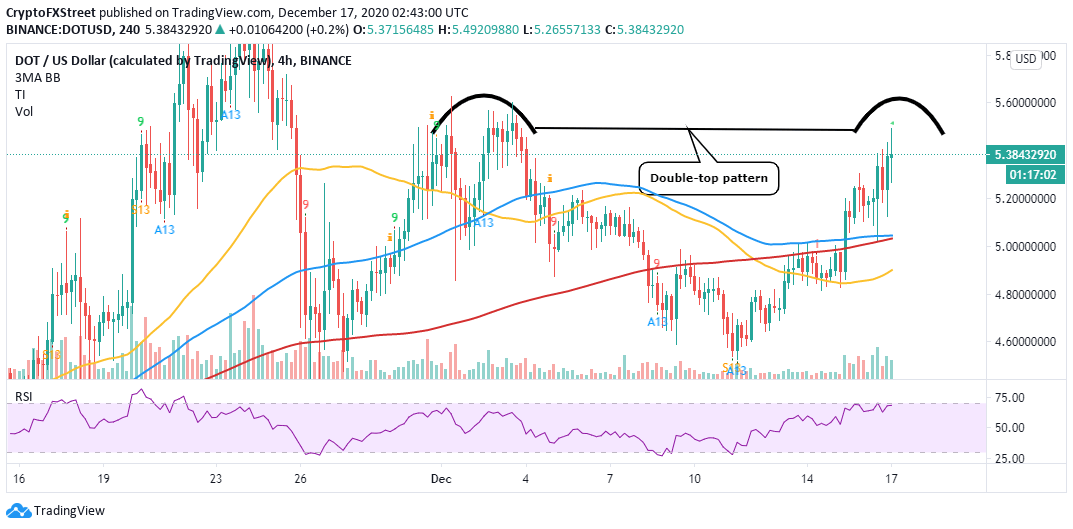
DOT/USD 4-hour chart
In this case, Polkadot must break under the initial critical support at $5.2 to confirm the bearish formation. Meanwhile, the 200 Simple Moving Average on the 4-hour chart could cross above the 100 SMA, forming a death cross. A pattern like this is regarded as bearish and could lead to the asset losing momentum significantly.
The TD Sequential indicator has presented a sell signal on the DOT/USD 12-hour chart, adding credence to the bearish outlook. The bearish formation developed as a green nine candlestick anticipating a correction in one to four candlesticks.
A red two candlestick trading below a preceding red one candle could serve as confirmation that Polkadot is ready to drop further.
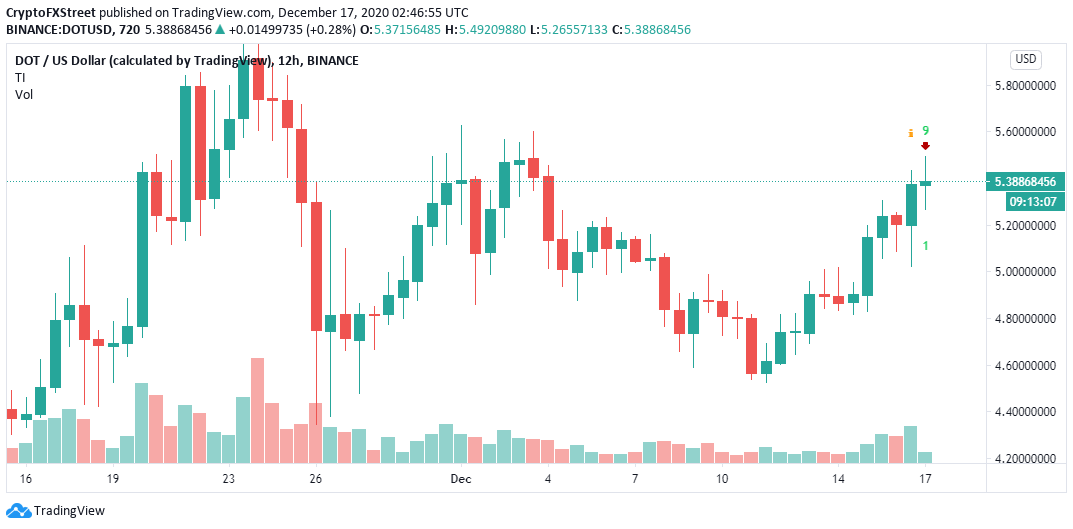
DOT/USD 12-hour chart
It is worth mentioning that Polkadot may continue with the uptrend above $5.6 and perhaps test the hurdle at $6 in the expected bearish formation is ignored. The Relative Strength Index is leveling under the overbought, which means DOT still has room for growth. Therefore, upward price action is still possible in the near term.
Author

John Isige
FXStreet
John Isige is a seasoned cryptocurrency journalist and markets analyst committed to delivering high-quality, actionable insights tailored to traders, investors, and crypto enthusiasts. He enjoys deep dives into emerging Web3 tren


