Polkadot downtrend intensifies ahead of the launch of Polkastarter DEX
- Polkadot downtrend is intact following another rejection at the 200 SMA on the 4-hour chart.
- The network's new DEX platform, Polkastarter, is set to go live on December 15.

Polkadot downtrend has been consistent within a descending parallel channel since the beginning of December. Recent support at $4.6 gave way for a rebound towards $5, but the channel's upper boundary cut short the breakout. The downtrend is underway at the time of writing and is likely to progress to $4.5.
Polkadot bearish leg could refresh $4.4 support
DOT/USD is trading at $4.77 while seeking support at the descending channel's middle boundary. The Relative Strength Index appears to be confirming the bearish outlook as it gradually slopes under the midline.
Massive sell orders will be triggered if Polkadot slides below the middle boundary support. Further down, additional support is envisaged at the channel's lower boundary while $4.5 is the primary anchor.
-637431859892879525.png)
DOT/USD 4-hour chart
The TD Sequential indicator will likely present a sell signal on the weekly chart in the coming days. The bearish outlook will manifest in a green nine candlestick. If validated, Polkadot's breakdown to $4.4 would become apparent.
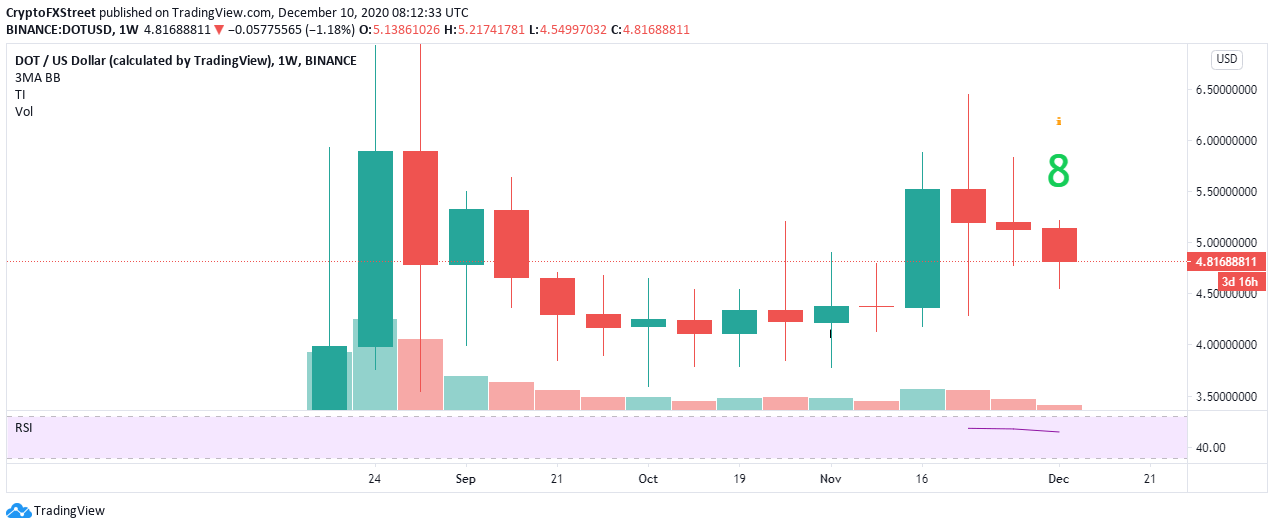
DOT/USD weekly chart
The launch of Polkastarter DEX may invalidate the downtrend
Polkadot has announced the launch of a decentralized exchange (DEX) dubbed Polkastarter. The platform aims to provide projects in the decentralized finance (DeFi) sector with a way to raise funds. Polkastarter was first mentioned in September but will launch on December 15.
Polkadot reckons that some projects were set to raise funds on the platform even before the official launch date. The release of this new platform might see DOT gain some ground in price action, perhaps with more investors paying attention to the development. An increase in demand for DOT could see the potential sell signal on the weekly chart nullified.
Author

John Isige
FXStreet
John Isige is a seasoned cryptocurrency journalist and markets analyst committed to delivering high-quality, actionable insights tailored to traders, investors, and crypto enthusiasts. He enjoys deep dives into emerging Web3 tren


