Polkadot price is poised for a 60% move, critical pattern suggests
- Polkadot price is bounded inside a long-term symmetrical triangle pattern on the daily chart.
- The digital asset will most likely see a breakout or breakdown by the end of 2020.

Polkadot had a huge rally since it started trading in August 2020, jumping towards its all-time high at $6.8 on September 1. Since then, the digital asset has been under consolidation and now awaits a clear breakout or breakdown of its consolidation pattern, currently trading at $5.10.
Polkadot Price at a do-or-die scenario
On the daily chart, DOT has established a long symmetrical triangle pattern which seems to be close to a breakout or breakdown. On December 11, bulls defended the lower trendline support of the figure and now aim to push Polkadot price towards the upper boundary at $5.7.
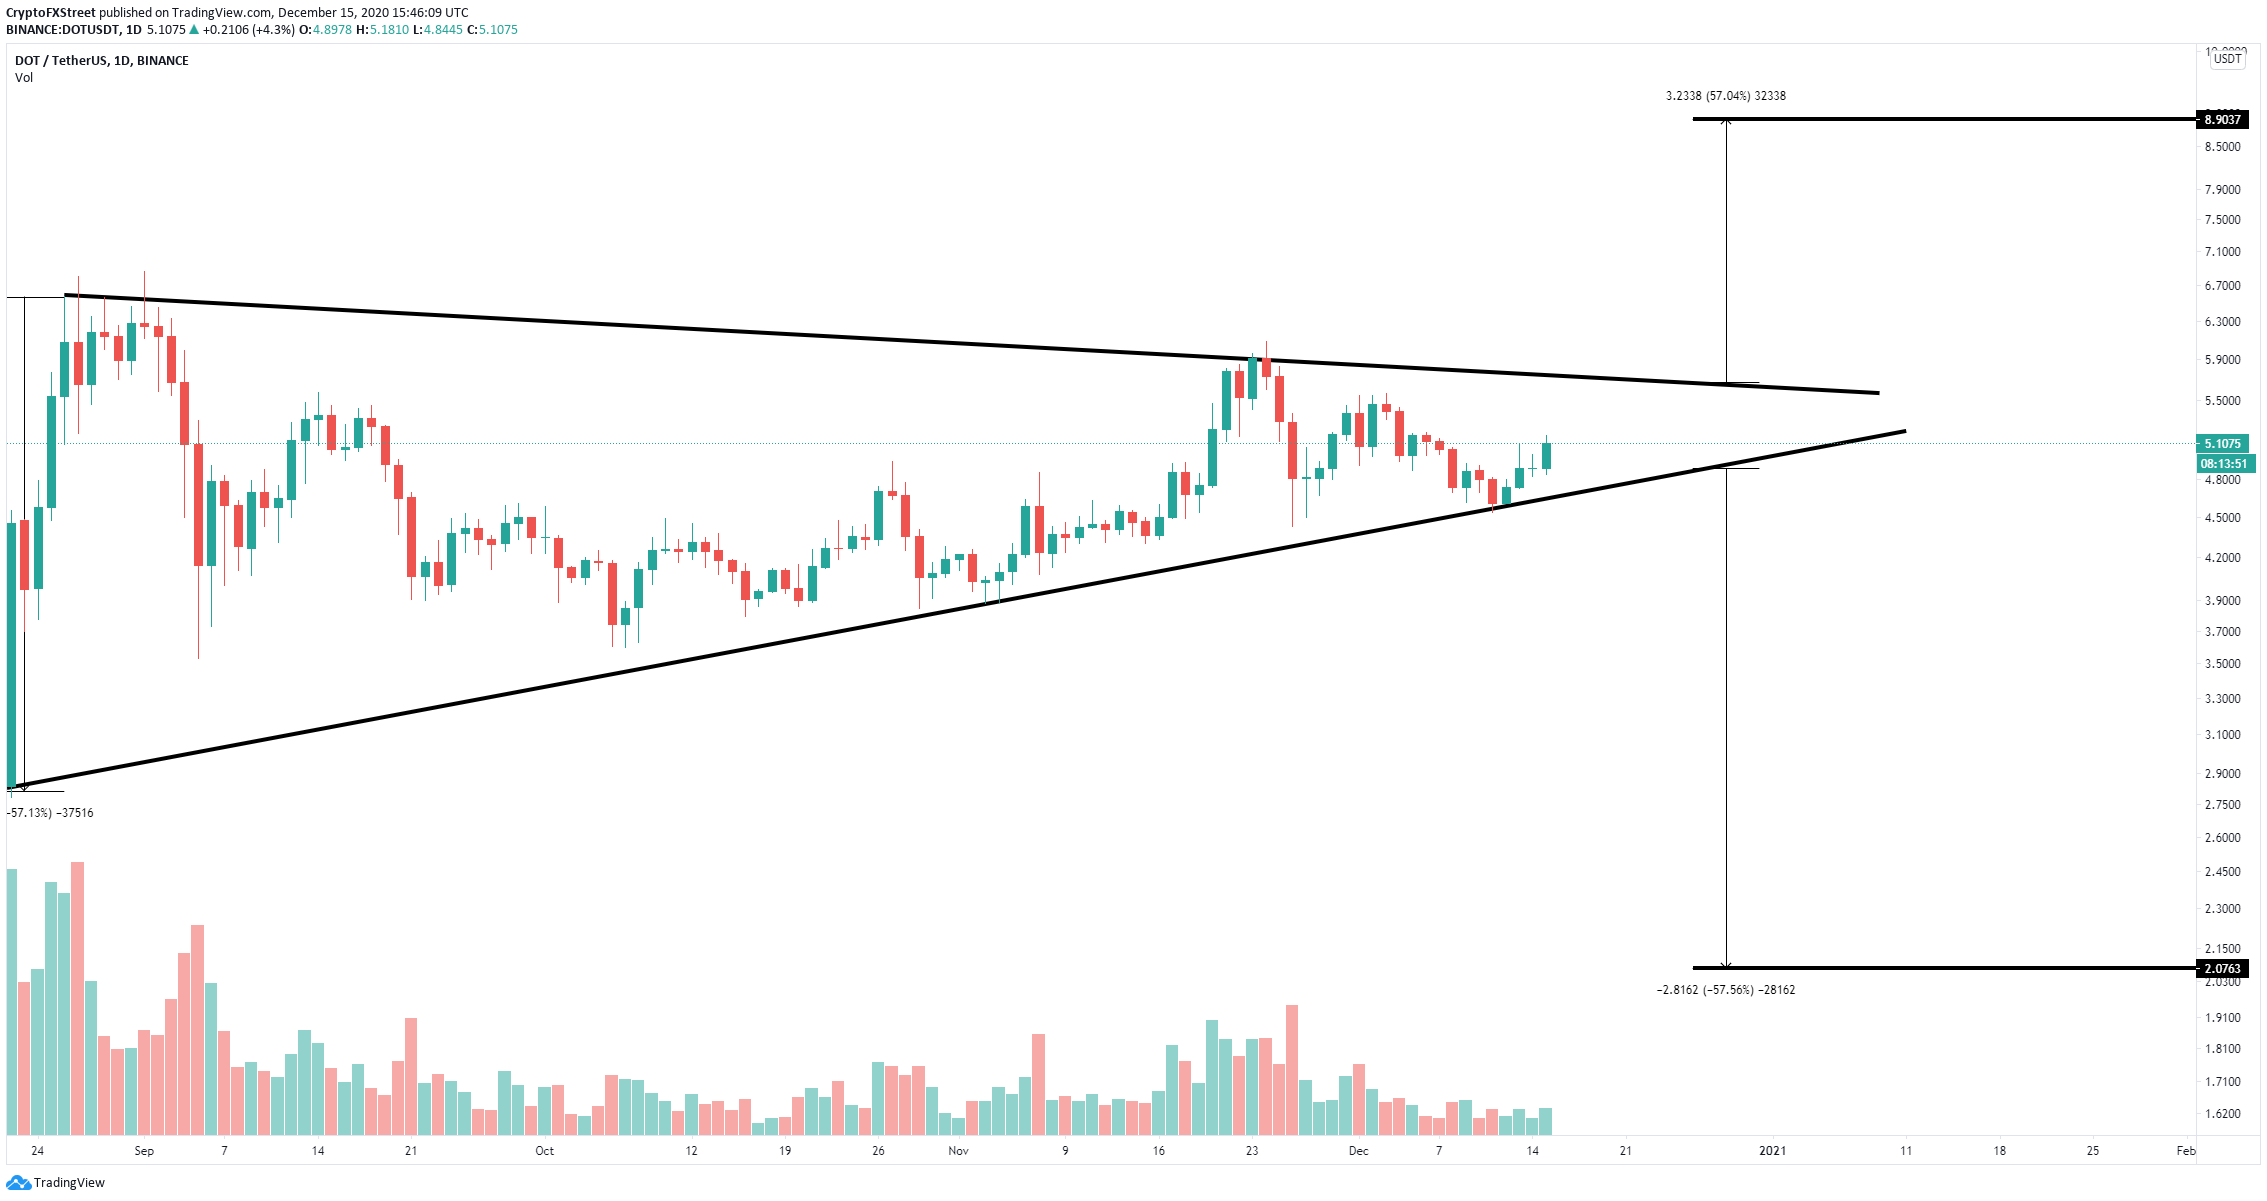
DOT/USD daily chart
A breakout above the upper boundary of the symmetrical pattern would drive Polkadot price towards $8.9 in the long-term, a new all-time high. At the same time, bulls have pushed DOT above the 50-SMA, 100-SMA and 200-SMA on the 4-hour chart, turning all three into support levels.
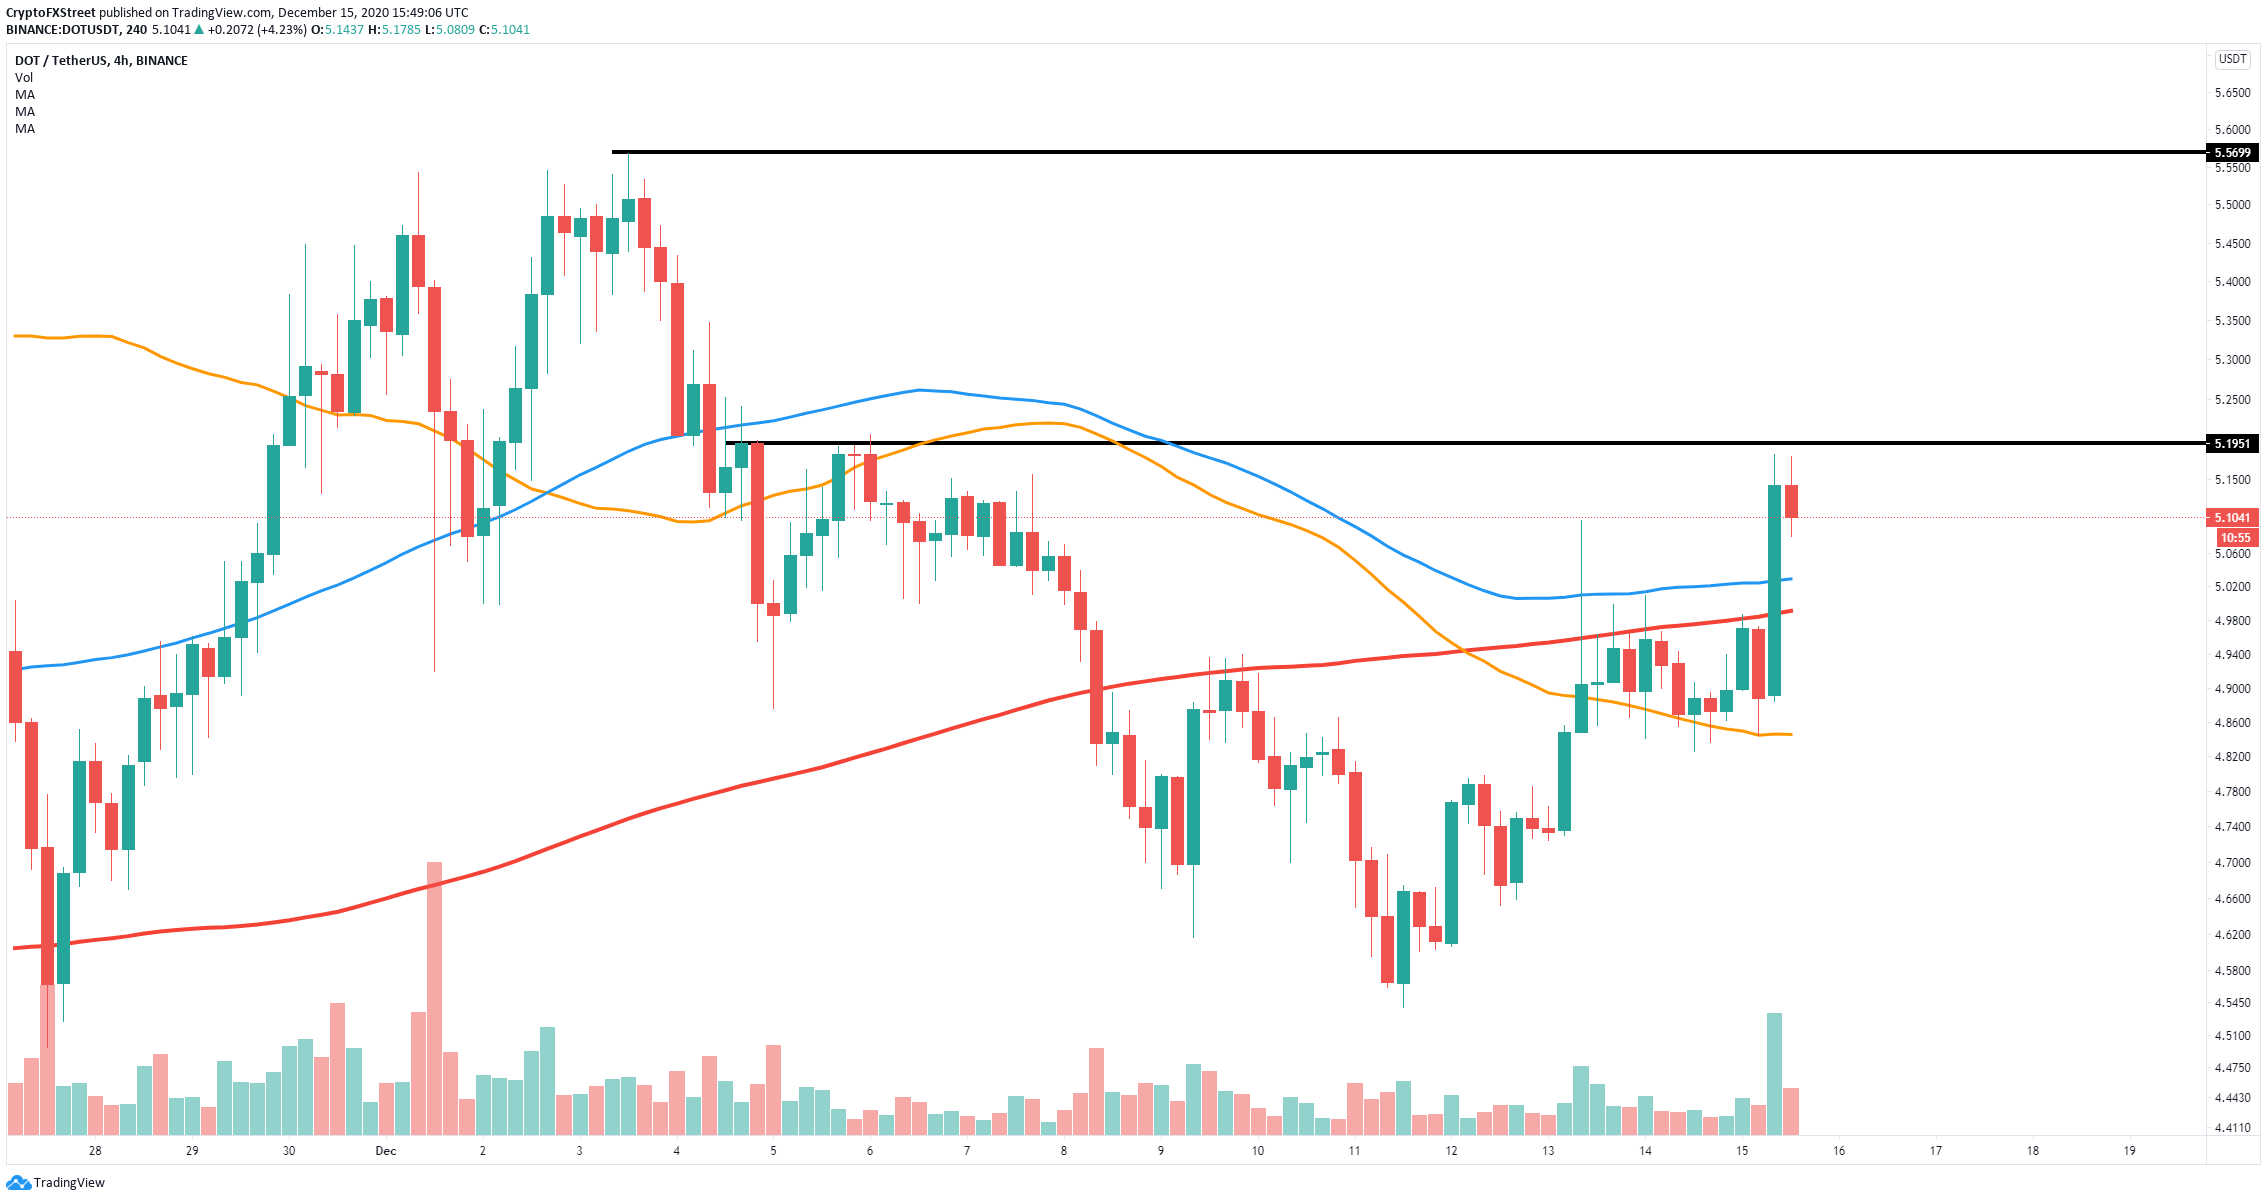
DOT/USD 4-hour chart
Polkadot has established a 4-hour uptrend climbing above several resistance levels. The next most significant resistance point is located at $5.19. A breakout above this level would quickly push the digital asset towards $5.57.
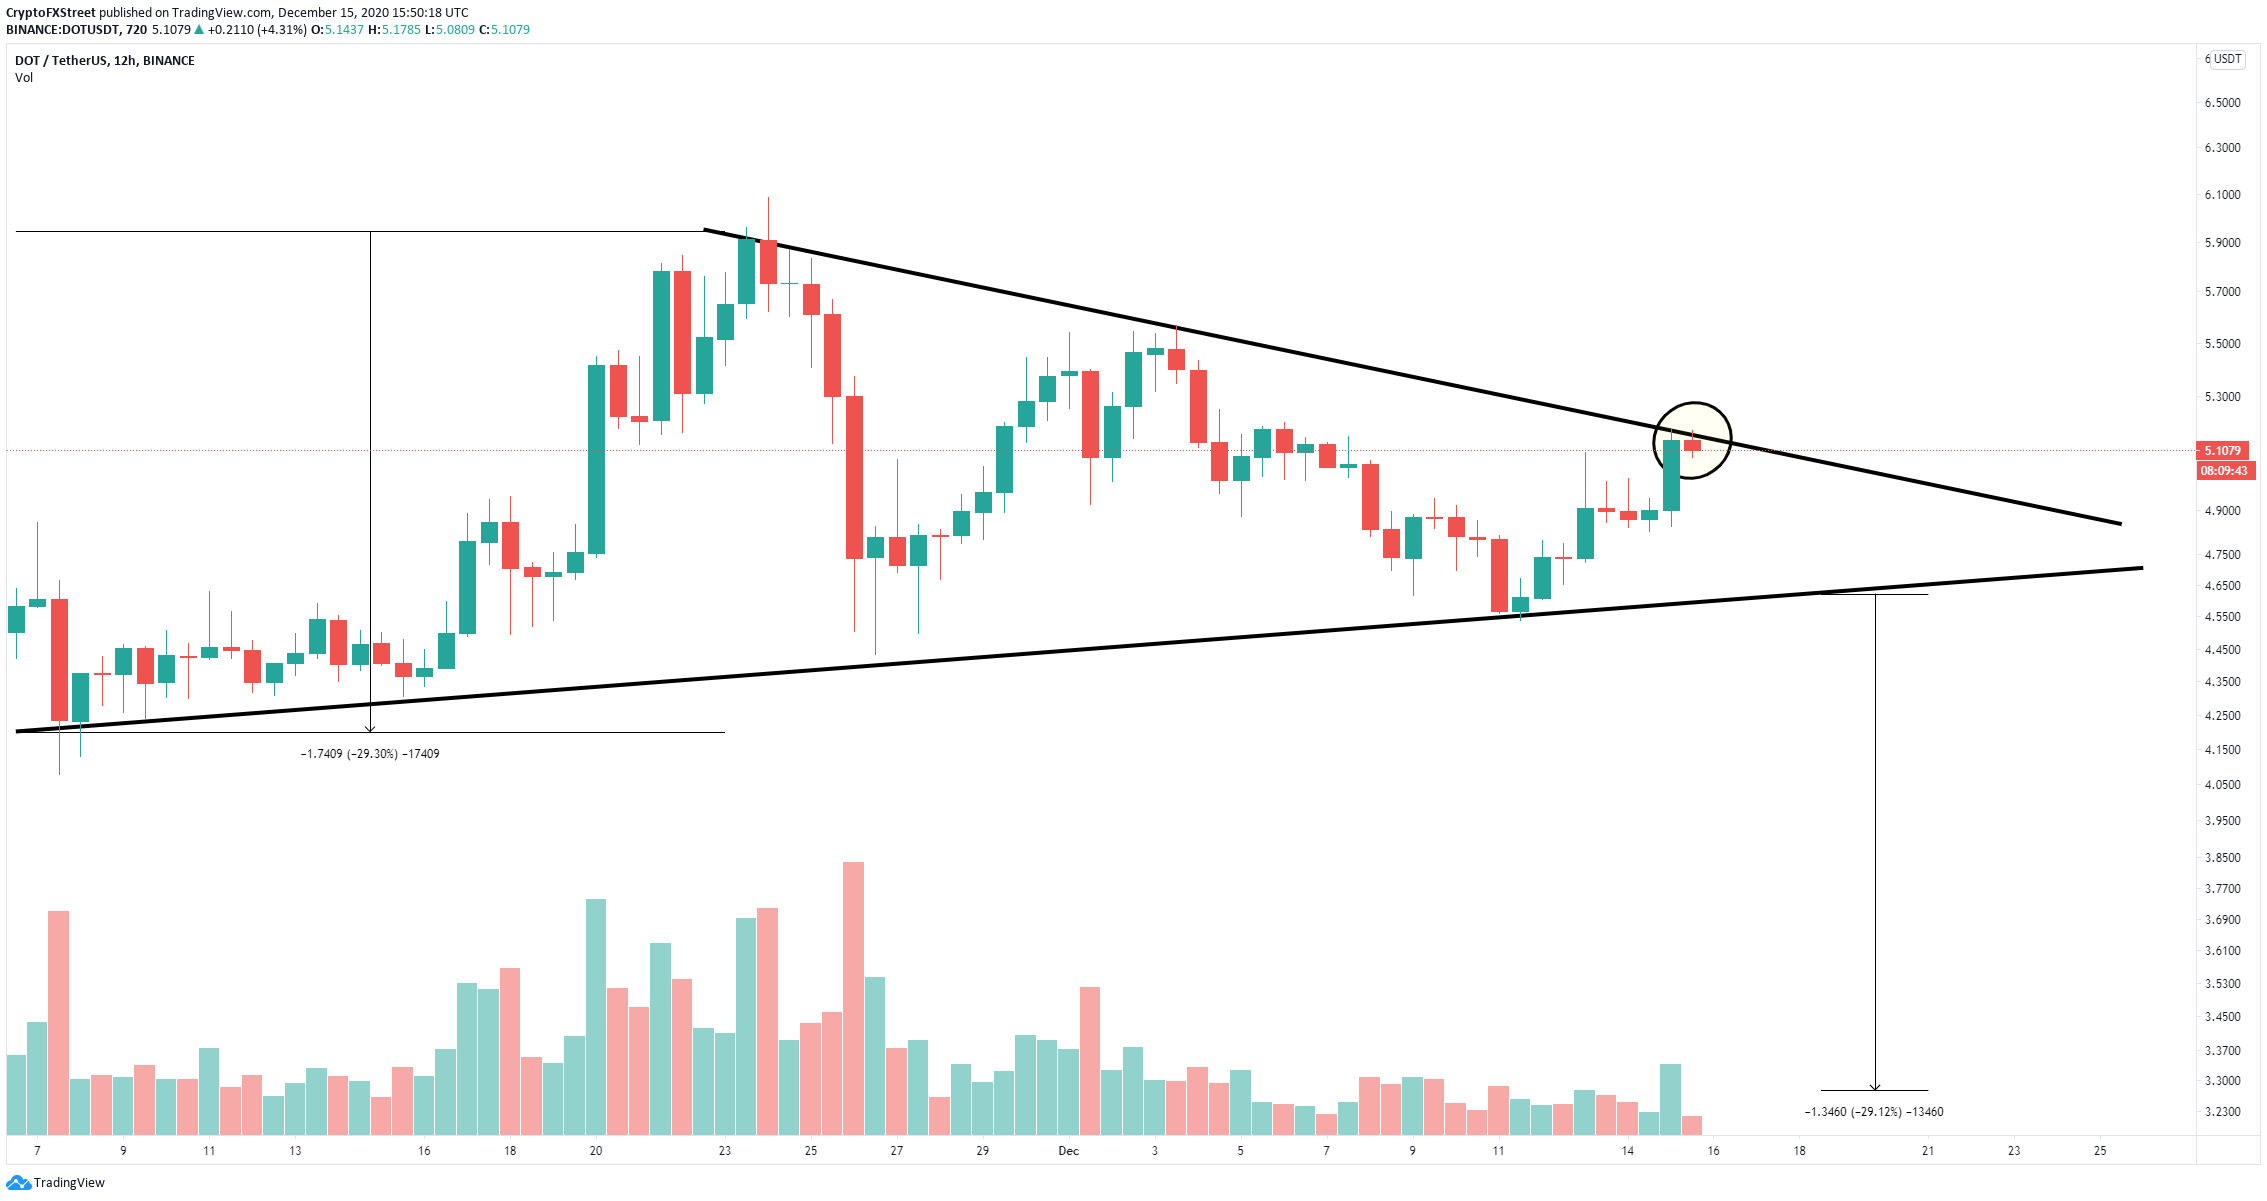
DOT/USD 12-hour chart
However, on the 12-hour chart, another short-term symmetrical triangle formed is acting as a strong resistance level. Failure to breakout above $5.19 will drive Polkadot price towards the lower trendline at $4.57. A breakdown below this point would push DOT towards $3.27 and would also represent a breakdown below the long-term triangle pattern on the daily chart, with a price target of $2.
Author

Lorenzo Stroe
Independent Analyst
Lorenzo is an experienced Technical Analyst and Content Writer who has been working in the cryptocurrency industry since 2012. He also has a passion for trading.


