Polkadot price displays bearish strength likely to fall to $11
- DOT price has breached a consolidative trend channel.
- Polkadot price has Fibonacci targets at $11 and $8.
- Invalidation of the bearish downtrend would be a breach at $17.70.

Polkadot price is prepping for a shocking sell-off unexpected by long-term investors. Profit-taking is highly advised under the current market conditions.
Polkadot price shows troubling signs
Polkadot price has accomplished last week's bearish trade setup as the price has breached a parallel channel. The steep declining bear rally has suppressed the DOT price into the $15 zone. The DOT price is likely to consolidate and potentially make a new low before coming back to retest the breached trend channel. Traders should look to short the digital asset if the DOT price displays a classical break and retest price action.
Polkadot price has a Fibonacci projection target coinciding with further declines. Fib levels from swing the high at $24 to the retracement at $19.5 forecast a 1.618 and 2.618 target at $11 and $8. The DOT bears have printed the largish bearish engulfing within the current downtrend on May 1st on the 8-hour chart, thus setting the tone for the rest of May if market conditions consist.
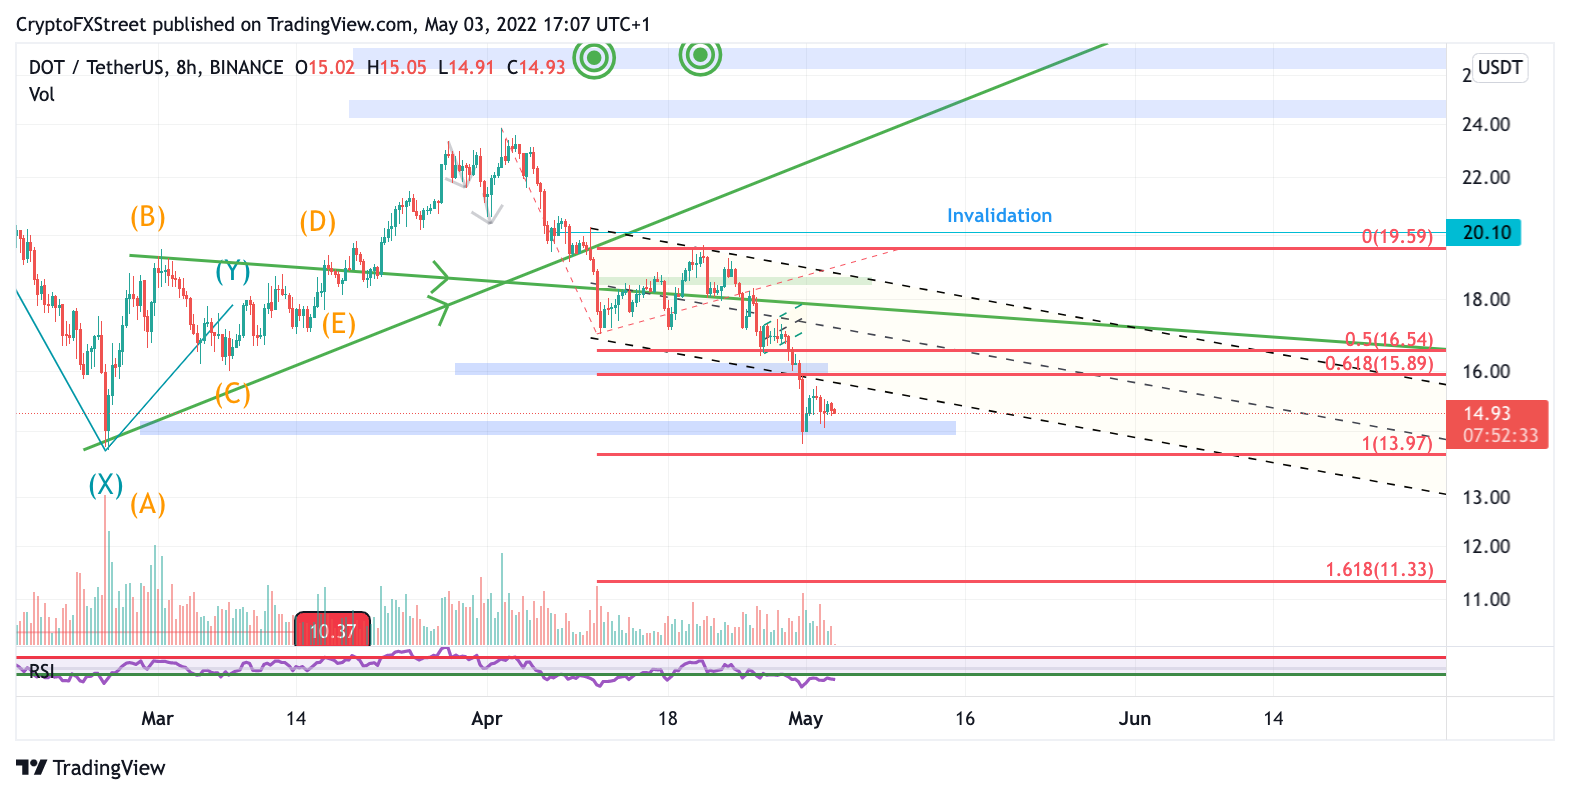
DOT/USDT 8-Hour Chart
Invalidation of the bearish downtrend is a breach at $17.70. If the bulls can touch this level, they could have the power to reconquer the trend. Bullish targets would be $20 and $22, resulting in a 50% increase from the current price.
Author

Tony M.
FXStreet Contributor
Tony Montpeirous began investing in cryptocurrencies in 2017. His trading style incorporates Elliot Wave, Auction Market Theory, Fibonacci and price action as the cornerstone of his technical analysis.


