Three reasons to be bearish on Bitcoin

Bitcoin is holding up well taking into account the uncertainty stemming from the Middle East. Despite this week’s rally, the long-term outlook remains bearish. Here are three reasons why I think the storm for the largest cryptocurrency isn't over yet.
The recent price consolidation has renewed hopes that the correction is over. While many market participants indeed believe the BTC price is bottoming out, I think the worst is yet to come.
1) A potential war-related inflation spike weighs
The Israel-US war on Iran has shaken global financial markets. Fears of a prolonged blockage of the Strait of Hormuz, which controls roughly 20% of global Oil supply, have already led to an increase in Crude prices of more than 15%.
Due to the ongoing war, Oil shipping routes have been disrupted, leading to constrained global supply. Many countries currently have limited strategic Oil reserves that could cover demand for only a short period – and prolonged disruptions could further strain supply.
A steady and prolonged rally in Oil prices would almost certainly add upward pressure on global inflation as higher energy costs ripple through transportation and production, raising the costs of goods and services for consumers.
This would occur at a time when many central banks around the world are still grappling with inflation that is above target. This scenario would not only rule out further rate cuts by, let’s say, the Fed or the ECB, but even put on the table the possibility of tightening policy.
Bitcoin doesn’t like this. BTC and the broader crypto market generally struggle in high-interest-rate environments because high borrowing costs reduce market liquidity and steer markets towards safer, yield-bearing assets.
In other words, investors may abandon Bitcoin in favor of safe-haven assets such as the US Dollar or Gold.
While it’s true that Bitcoin has long been touted by its supporters as the ultimate safe-haven asset, markets don’t widely consider it as a traditional destination during acute market crashes.
2) On-chain metrics don’t signal any bottom
With the Crypto King correcting more than 50% from its all-time high, many crypto gurus have resurfaced with statements such as “BTC is undervalued”, “Buy the dips”, or “We’re never getting BTC at $60K or $70K.”
However, rather than following the herd mentality, smart investors should focus on objective valuation metrics to determine whether Bitcoin is genuinely undervalued under current market conditions.
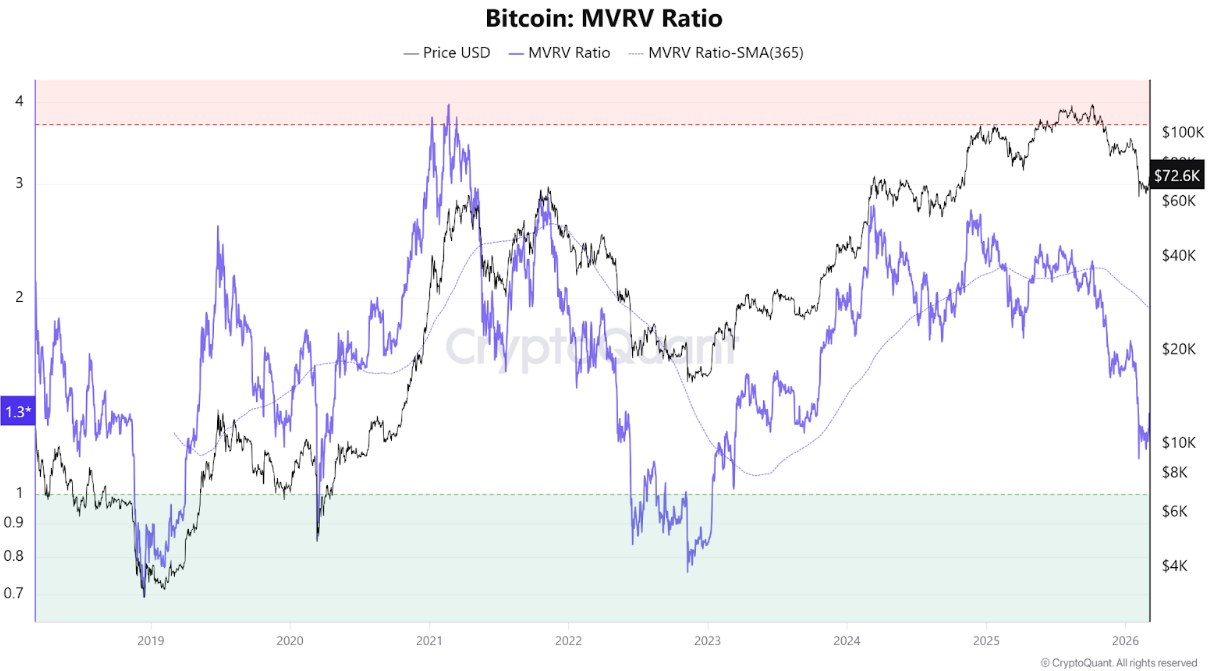
Some valuation metrics from CryptoQuant provide a clearer picture of this. For example, the Market Value to Realized Value (MVRV) ratio stands at 1.3, outside the extreme undervalued area (highlighted in green in the chart below), where historically market bottoms have formed.
History shows that once MVRV enters this zone –again, something that hasn’t happened yet – the market has generally required four to five months to establish a sustainable base.
While this indicates that Bitcoin is near its fair value, but not at the undervalued levels that have historically signaled a bear-market bottom.
Similarly, the Net Unrealized Profit/Loss chart (NUPL), a measure of BTC holders’ profit/loss margins, remains well above the extreme undervalued area (blue line) and is trending downward.
Historically, price bottoms form when holders are experiencing ~20% unrealized losses, which is not the case today.
-1772701361947-1772701361948.png)
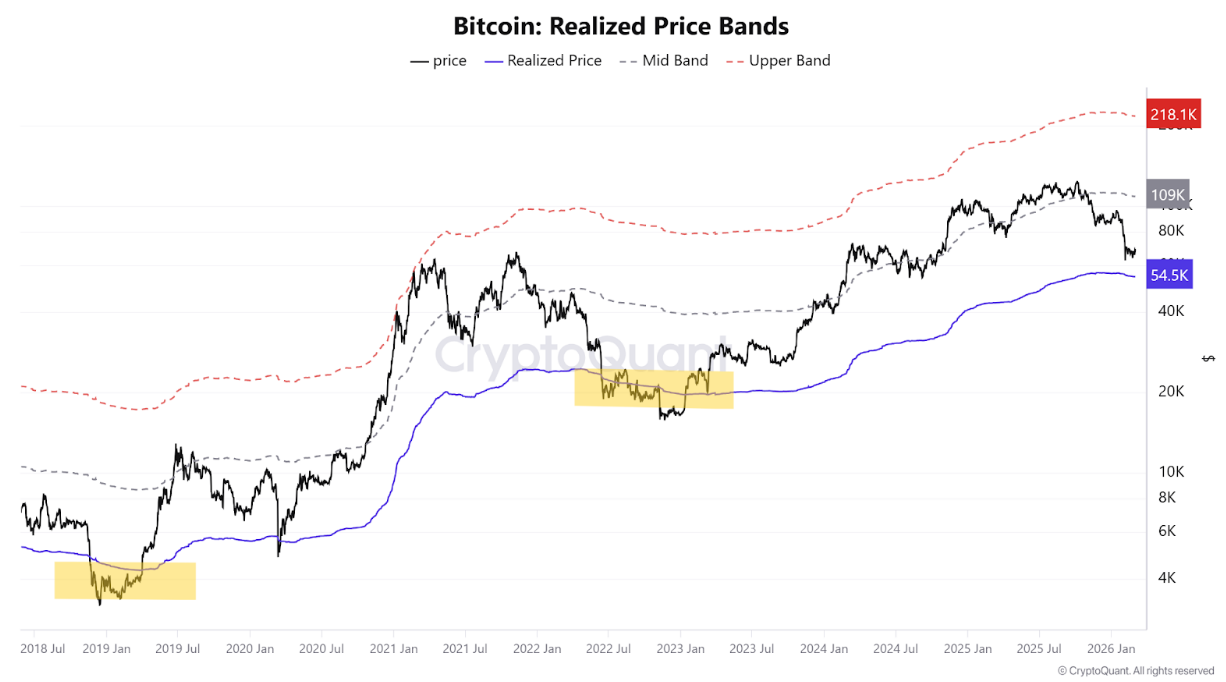
Key valuation metrics point to a possible bottom for BTC around $56,500. This estimate comes after analyzing Bitcoin’s realized price bands, which have historically served as major support areas during previous bear markets (see chart below).
In the previous two bear markets (November 2022 after the FTX collapse and December 2018), BTC price crossed below these price bands by 24% and 30%, respectively. Then, once the price reaches this level, it tends to stabilize for 4-6 months.
Currently, the price of Bitcoin still stands 22% above this mark. So, again, no signs of bottom yet.
3) The technical outlook mirrors the late 2021 to 2022 bear market
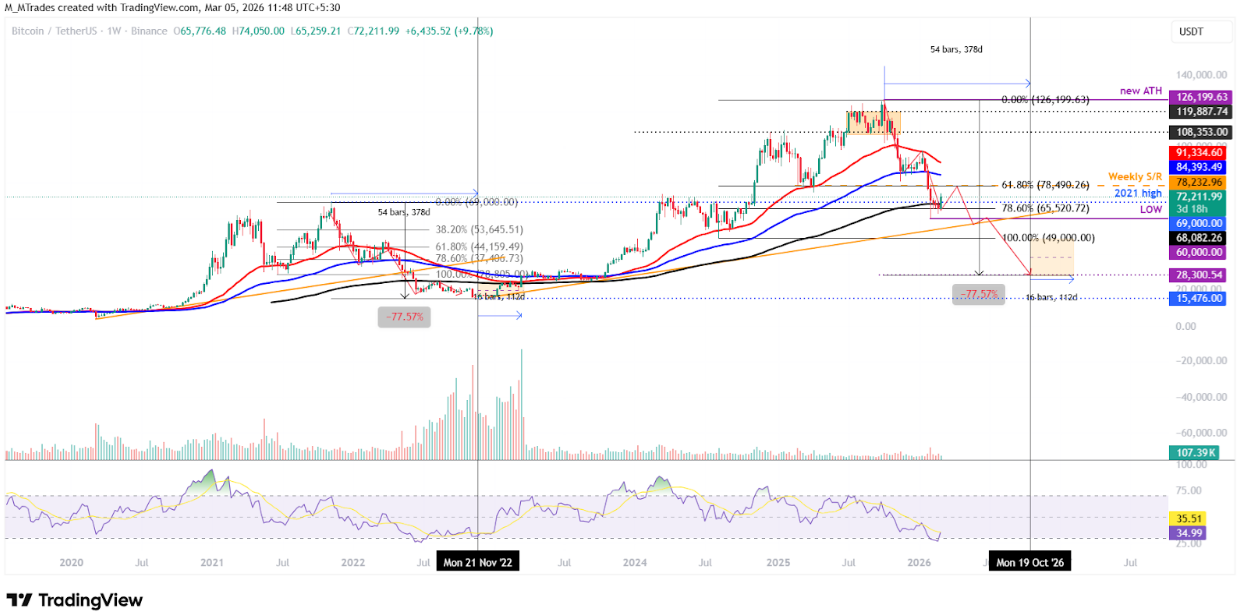
The Bitcoin weekly chart shows price action resembling that of the late-2021 and 2022 bear market.
In 2021, BTC hit a new all-time high of $69,000 in November, then corrected by more than 77% to a bottom of around $15,476 in November 2022, taking 378 days. Bitcoin then consolidated for the next 112 days before the start of another bull cycle in 2023.
Now let’s look at the current cycle: BTC reached a new all-time high at $126,199 in October 2025 and has since corrected by over 50% through the end of February, closing below the 200-week Exponential Moving Average at $68,087.
Such a massive price correction is often supported by short-term relief periods within a broader downward trend, as seen so far this week with BTC, which gained 10% and traded above $72,500 as of Thursday. These short-term upward movements are normal and were also seen during the previous bear market cycle.
If the 2021-2022 pattern holds, BTC could reach a low of $28,300 (77.51% down from the 2025 ATH) by roughly mid-October. Then, it would need around 100 more days before the start of another bull cycle.
Taken all together: Bitcoin’s resilience in recent days has revived optimism among traders, but the broader picture tells a more cautious story. Rising inflation risks, valuation metrics that have yet to signal capitulation and a technical structure echoing previous bear markets all point to the possibility that the current rebound is simply a relief within a larger downtrend.
The calm in Bitcoin may be temporary – and the crypto market may still be navigating the middle of the storm rather than approaching its end.
Author

Manish Chhetri
FXStreet
Manish Chhetri is a crypto specialist with over four years of experience in the cryptocurrency industry.


