|

Polkadot price disappoints traders as bears flex control; the next target is $18.50

  • Polkadot possibility for a 5th wave extension is void.
  • Polkadot price emitted strong sell signals on the RSI.
  • Invalidation for the bearish scenario is a close at or above $21.50.

Polkadot price could experience more selloffs in the coming days. There were clear indicators for traders to take profit from last month's successful trade setups.

Polkadot price will drop, but it's one to watch

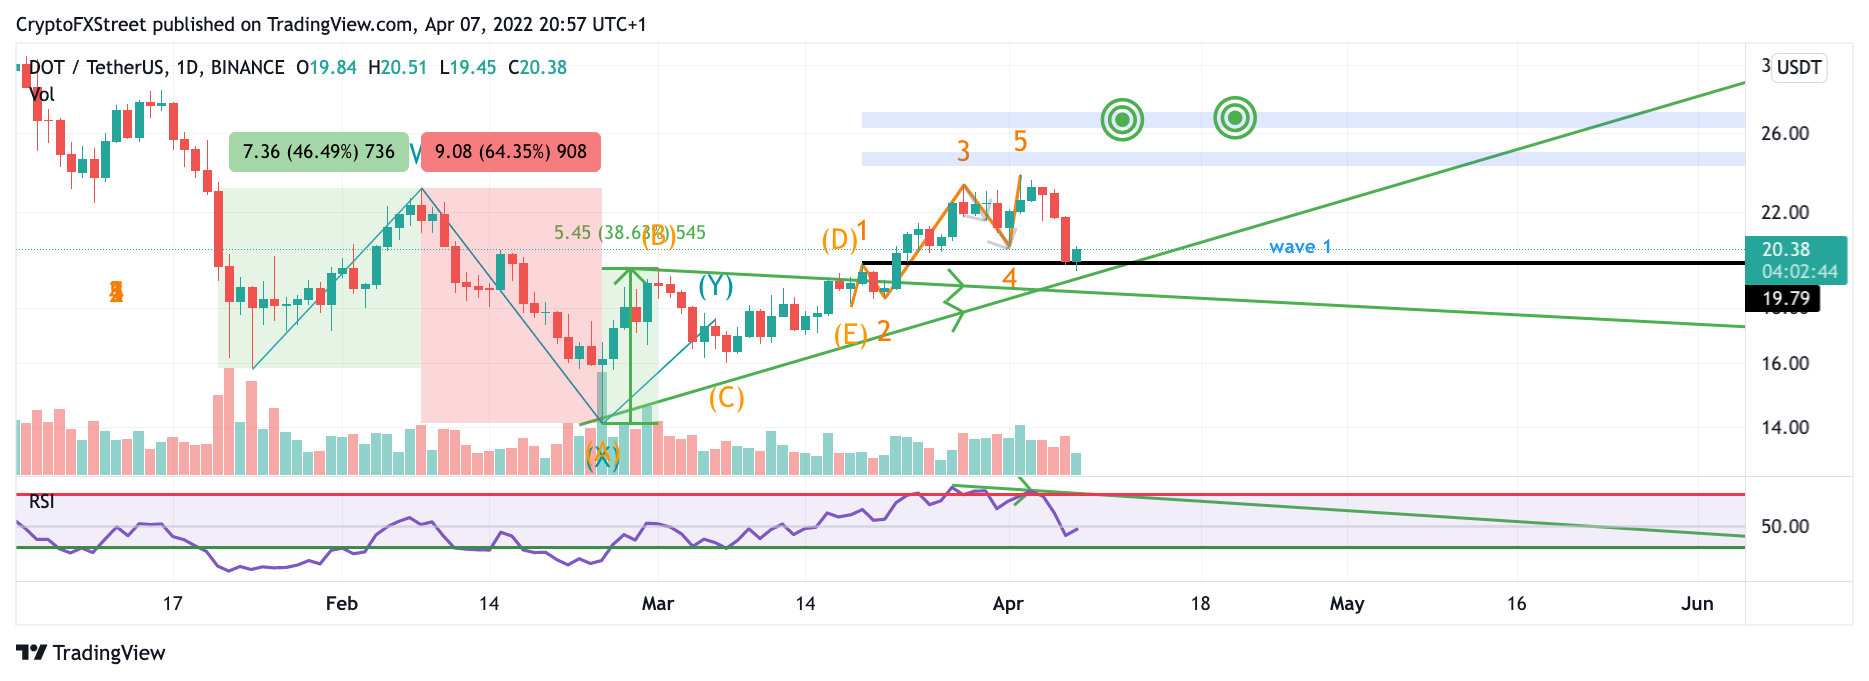
Polkadot price has disappointed analysts as the current bearish engulfing candle has completely invalidated any possibility for a Wave 4 count. Now that Wave 1 has been breached at $19.96, traders should expect the five-wave impulse to be over. A deep wave correction is possible. DOT price could see $18.50 levels in the coming days. 

The Polkadot price rally is likely over, and the Relative Strength Index is providing further confirmation. The apparent double top with a bearish divergence in the 60 levels was a screaming sell signal. Polkadot price has levels to retest in the $18 zone. Traders should allow the selloff to unfold but keep an open eye for potential buy opportunities in the said area.
dot 4/7/22

DOT/USDT 1-Day Chart

If the bulls can establish a closing candle into the $21.50 low, crypto analysts will consider the downtrend thesis invalid and begin looking for buy opportunities. If the Elliot Wave count is correct, the Polkadot price could rally towards the $26 and $27 levels, resulting in a 30% increase from the current price.

Author

FXStreet Team

Composed of a group of economic journalists and FX experts, the FXStreet content team produces and oversees all content published on FXStreet. It provides a purely journalistic approach to the Forex market.

More from FXStreet Team
Share:

Editor's Picks

Bitcoin Weekly Forecast: BTC retreats as macro headwinds grow
Bitcoin (BTC) remains under pressure, down over 4% this week and trading around $76,900 at the time of writing on Friday. Institutional demand shows signs of weakness as spot BTC Exchange Traded Funds (ETFs) are on track to end their three-week inflow streak, recording nearly $500 million in net outflows through Thursday.
XRP falls toward key support as macro uncertainty, weak momentum cap recovery
Ripple (XRP) falls below $1.33 on Friday, marking the third consecutive day of declines. The token continues to track the broader cryptocurrency market downturn, with investors closely monitoring heightened macroeconomic uncertainty ahead of the United States (US) Consumer Price Index (CPI) release and next week’s Federal Reserve (Fed) monetary policy decision.
Crypto Today: Bitcoin, Ethereum, XRP stabilize at lower levels amid ETF outflows and macroeconomic risks
The broader cryptocurrency market is rising on Friday, with Bitcoin (BTC) trading above $77,000 after testing lower support near $76,500. Ethereum (ETH) shows signs of stability, hovering above the support provided at $2,400 despite capped upside at $2,500. Meanwhile, Ripple (XRP) holds above $1.33 after three straight days of declines, reflecting growing headwinds due to macroeconomic uncertainty.
Bitcoin pulls back as another golden cross fails to deliver
Earlier this week, Bitcoin formed a golden cross, a technical signal that occurs when the price’s 50-day moving average rises above the 200-day moving average and is conventionally viewed as a precursor to a bullish rally. Historically, however, that’s often not been the case.
Bitcoin: BTC retreats as macro headwinds grow
Bitcoin (BTC) remains under pressure, down over 4% this week and trading around $76,900 at the time of writing on Friday. Institutional demand shows signs of weakness as spot BTC Exchange Traded Funds (ETFs) are on track to end their three-week inflow streak, recording nearly $500 million in net outflows through Thursday.

