Ethereum Price Forecast: Active addresses halt growth as US selling pressure eases

Ethereum price today: $1,950
- Ethereum network growth has declined after two months of explosive increase.
- US selling pressure has eased following an improvement in the Coinbase Premium Index.
- ETH extends its range-bound move below the $2,107 resistance and above $1,740 .
Ethereum (ETH) network growth has stalled over the past week, halting an explosive rise over the past two months.
Active addresses and transaction counts surged to record highs during the period despite a 42% in ETH's price. However, both metrics have begun to decline over the past week.
-1771547296869-1771547296870.png)
The slowdown comes as prices have consolidated in the past two weeks following a sustained downtrend that spanned mid-January to early February.
At the same time, ETH's Net Taker Volume on Binance has remained in negative territory since January, indicating short traders continue to dominate futures activity on the crypto exchange. The Net Taker Volume measures the difference between buy and sell volumes of traders using market orders.
Despite continued signs of bearish dominance, US selling pressure is gradually easing. Outflows in US spot ETH exchange-traded funds (ETFs) have slowed over the last few days, with the products seeing net inflows of $6.8 million so far this week, according to SoSoValue data.
A similar trend is evident in the Coinbase Premium Index. Although the metric remains in negative territory, it has improved slightly from lows seen earlier this month.
-1771547358059-1771547358061.png)
Meanwhile, Ethereum Accumulation Addresses have intensified buying activity over the past few months as prices declined, representing one of the fastest growth rates on record.
-1771547429524-1771547429525.png)
Similarly, investors are pumping funds into ETH staking, with the queue of assets waiting to join active staking rising to 3.82 million ETH.
Ethereum Price Forecast: ETH extends consolidation below $2,107 resistance
In the daily chart, ETH/USDT trades at $1,950, down 0.2% in the past 24 hours as of writing. The 20-day Exponential Moving Average (EMA) at $2,157 slopes lower and continues to cap rebounds, preserving a bearish bias. Otherwise, a decisive close above the average would ease near-term pressure.
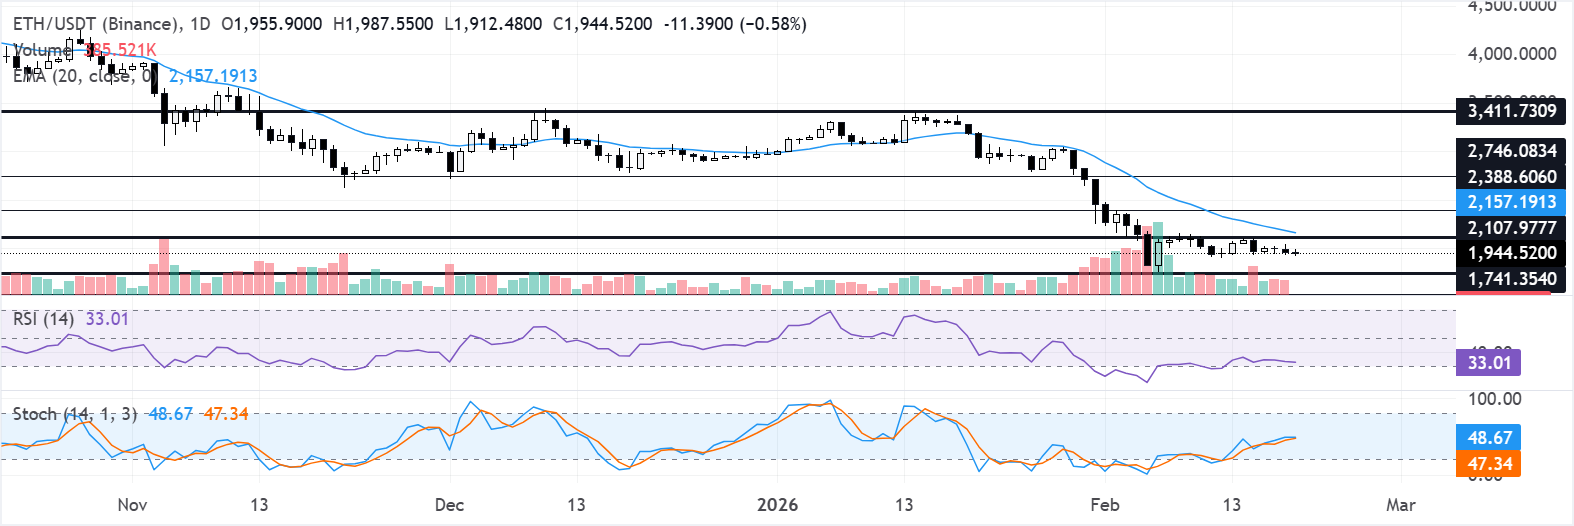
The Relative Strength Index (RSI) at 33 (near its oversold region) reflects weak momentum, and a move back above 50 could improve the tone. Immediate resistance aligns at $2,107, followed by $2,388. Support is seen at $1,741, then at $1,524. A break above the first barrier could extend toward the next resistance, while a loss of the initial floor would expose the lower support.
(The technical analysis of this story was written with the help of an AI tool.)
Author

Michael Ebiekutan
FXStreet
With a deep passion for web3 technology, he's collaborated with industry-leading brands like Mara, ITAK, and FXStreet in delivering groundbreaking reports on web3's transformative potential across diverse sectors. In addition to




