PancakeSwap Price Analysis: Bearish momentum suggests further downside
- PancakeSwap price extends its correction on Friday, losing nearly 8% so far this week.
- Derivatives data indicate a bearish bias, with funding rates turning negative alongside falling open interest.
- The technical outlook suggests bearish momentum is in control, targeting levels below $1.18.

PancakeSwap (CAKE) is trading below $1.26 at the time of writing on Friday, extending the losses by over 8% so far this week. The weakening derivatives market further supports the bearish outlook, with bears aiming for levels below $1.18.
CAKE’s derivatives market shows a negative outlook
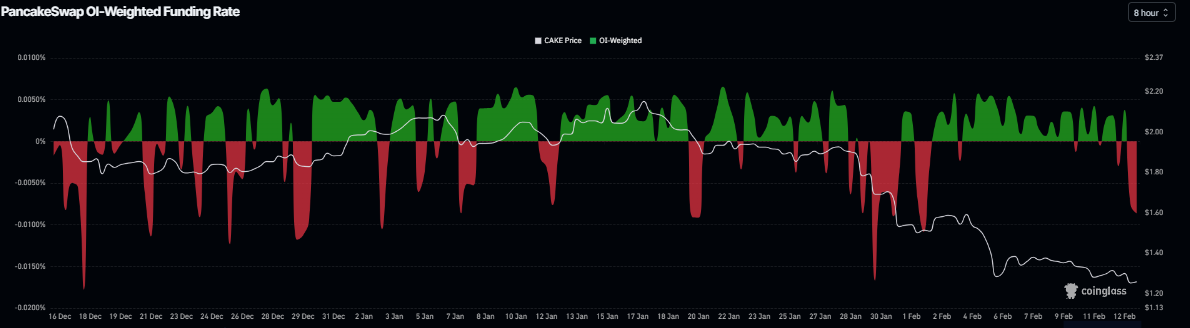
Derivatives data for PancakeSwap support a bearish outlook. Coinglass’s OI-Weighted Funding Rate data shows that the number of traders betting that the price of CAKE will slide further is higher than those anticipating a price increase.
The metric turned negative on Friday and stands at -0.0086%, approaching the level observed at the end of January’s price dips. The negative ratio suggests that shorts are paying longs, suggesting bearish sentiment toward CAKE.
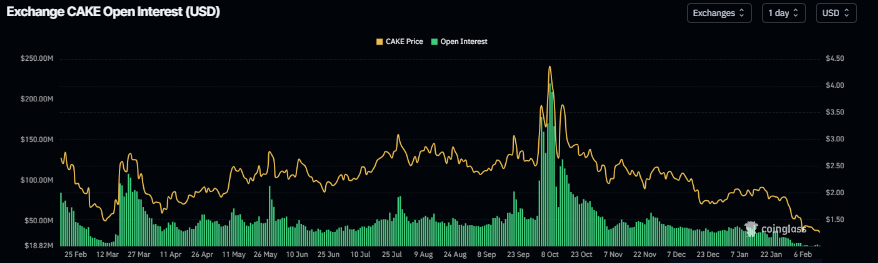
In addition, CAKE’s futures Open Interest (OI) drops to $19.73 million on Friday, reaching levels not seen since mid-March 2025, and has been steadily falling since the January 6 high of $43.57 million. This drop in OI reflects waning investor participation and projects a bearish outlook.
PancakeSwap Price Forecast: CAKE bears aiming for levels below $1.18
PancakeSwap price failed to find support around a previously broken descending trendline (drawn by connecting multiple lows since early November) on February 5. It sharply declined to $1.18 the next day before recovering to $1.40. CAKE has continued its correction, down nearly 8% so far this week, trading near $1.25 on Friday.
If CAKE continues its price correction, it could extend the decline toward the February 6 low of $1.18. A close below this level could extend the losses toward the February 3, 2025, low at $1.11.
The Relative Strength Index (RSI) on the daily chart is at 24, within the oversold territory, suggesting extreme bearish momentum. In addition, the Moving Average Convergence Divergence (MACD) line remains below its signal line in the same period, suggesting a continuation of the downward trend.
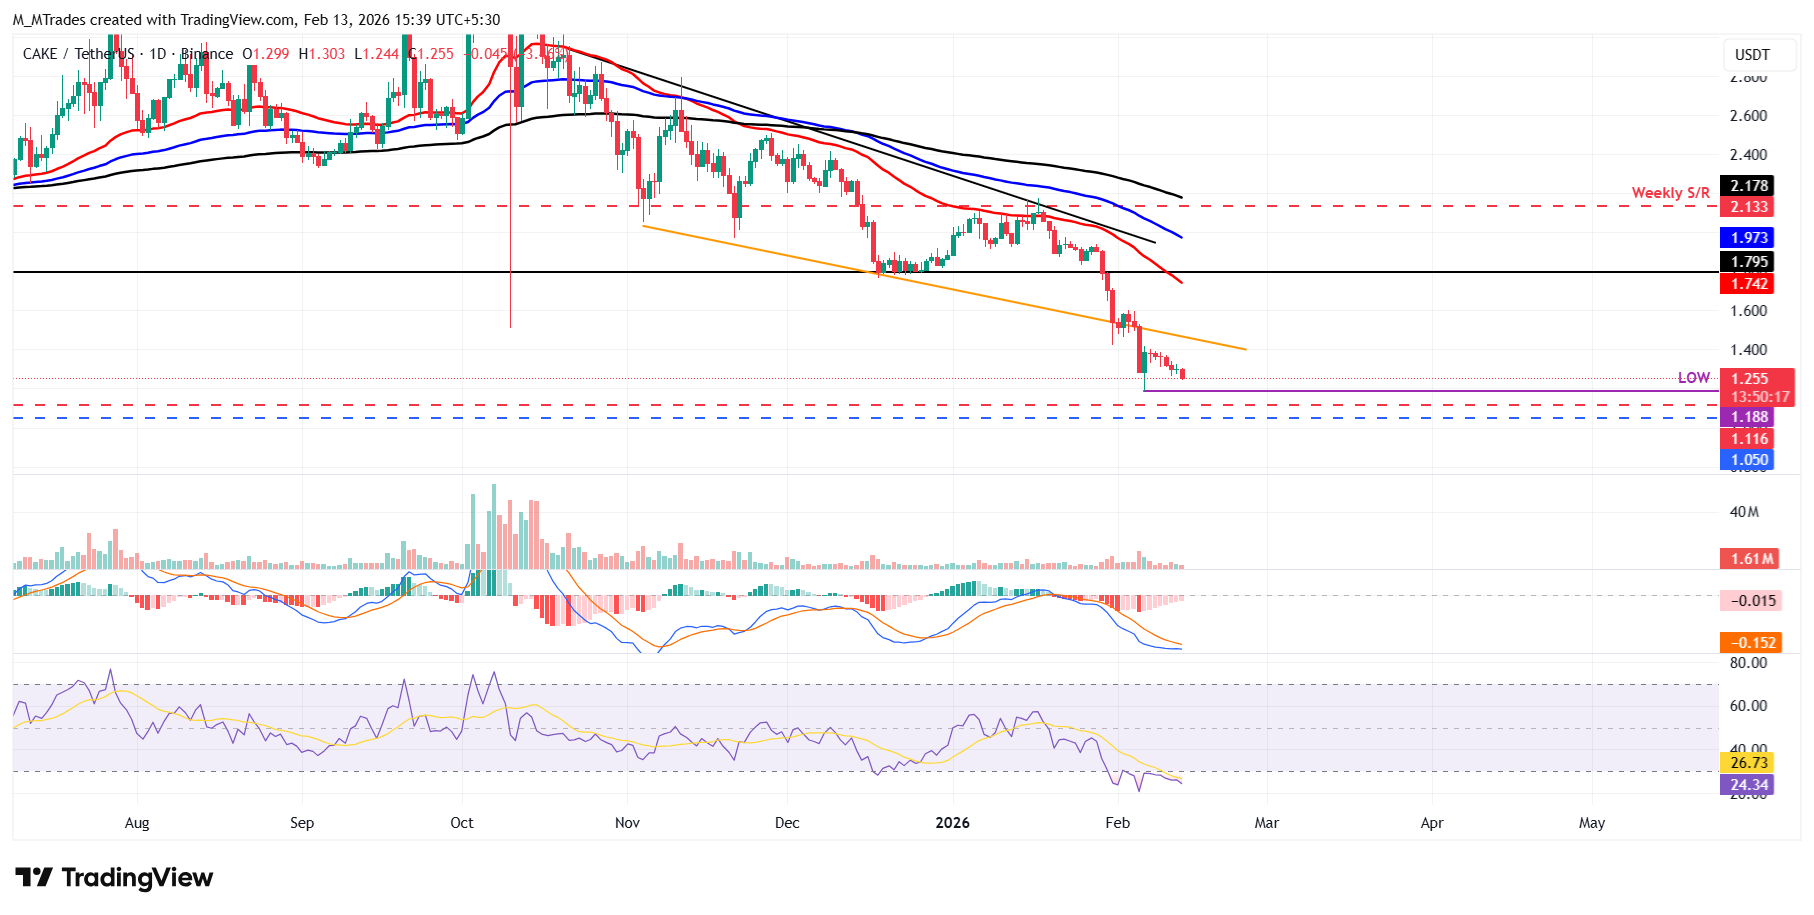
On the other hand, if CAKE recovers, it could extend the recovery toward the key psychological level at $1.50.
Author

Manish Chhetri
FXStreet
Manish Chhetri is a crypto specialist with over four years of experience in the cryptocurrency industry.



