Hyperliquid Price Forecast: HYPE extends recovery amid increasing retail interest
- Hyperliquid rises 5% so far on Friday, extending its recovery for the fourth consecutive day toward $30.
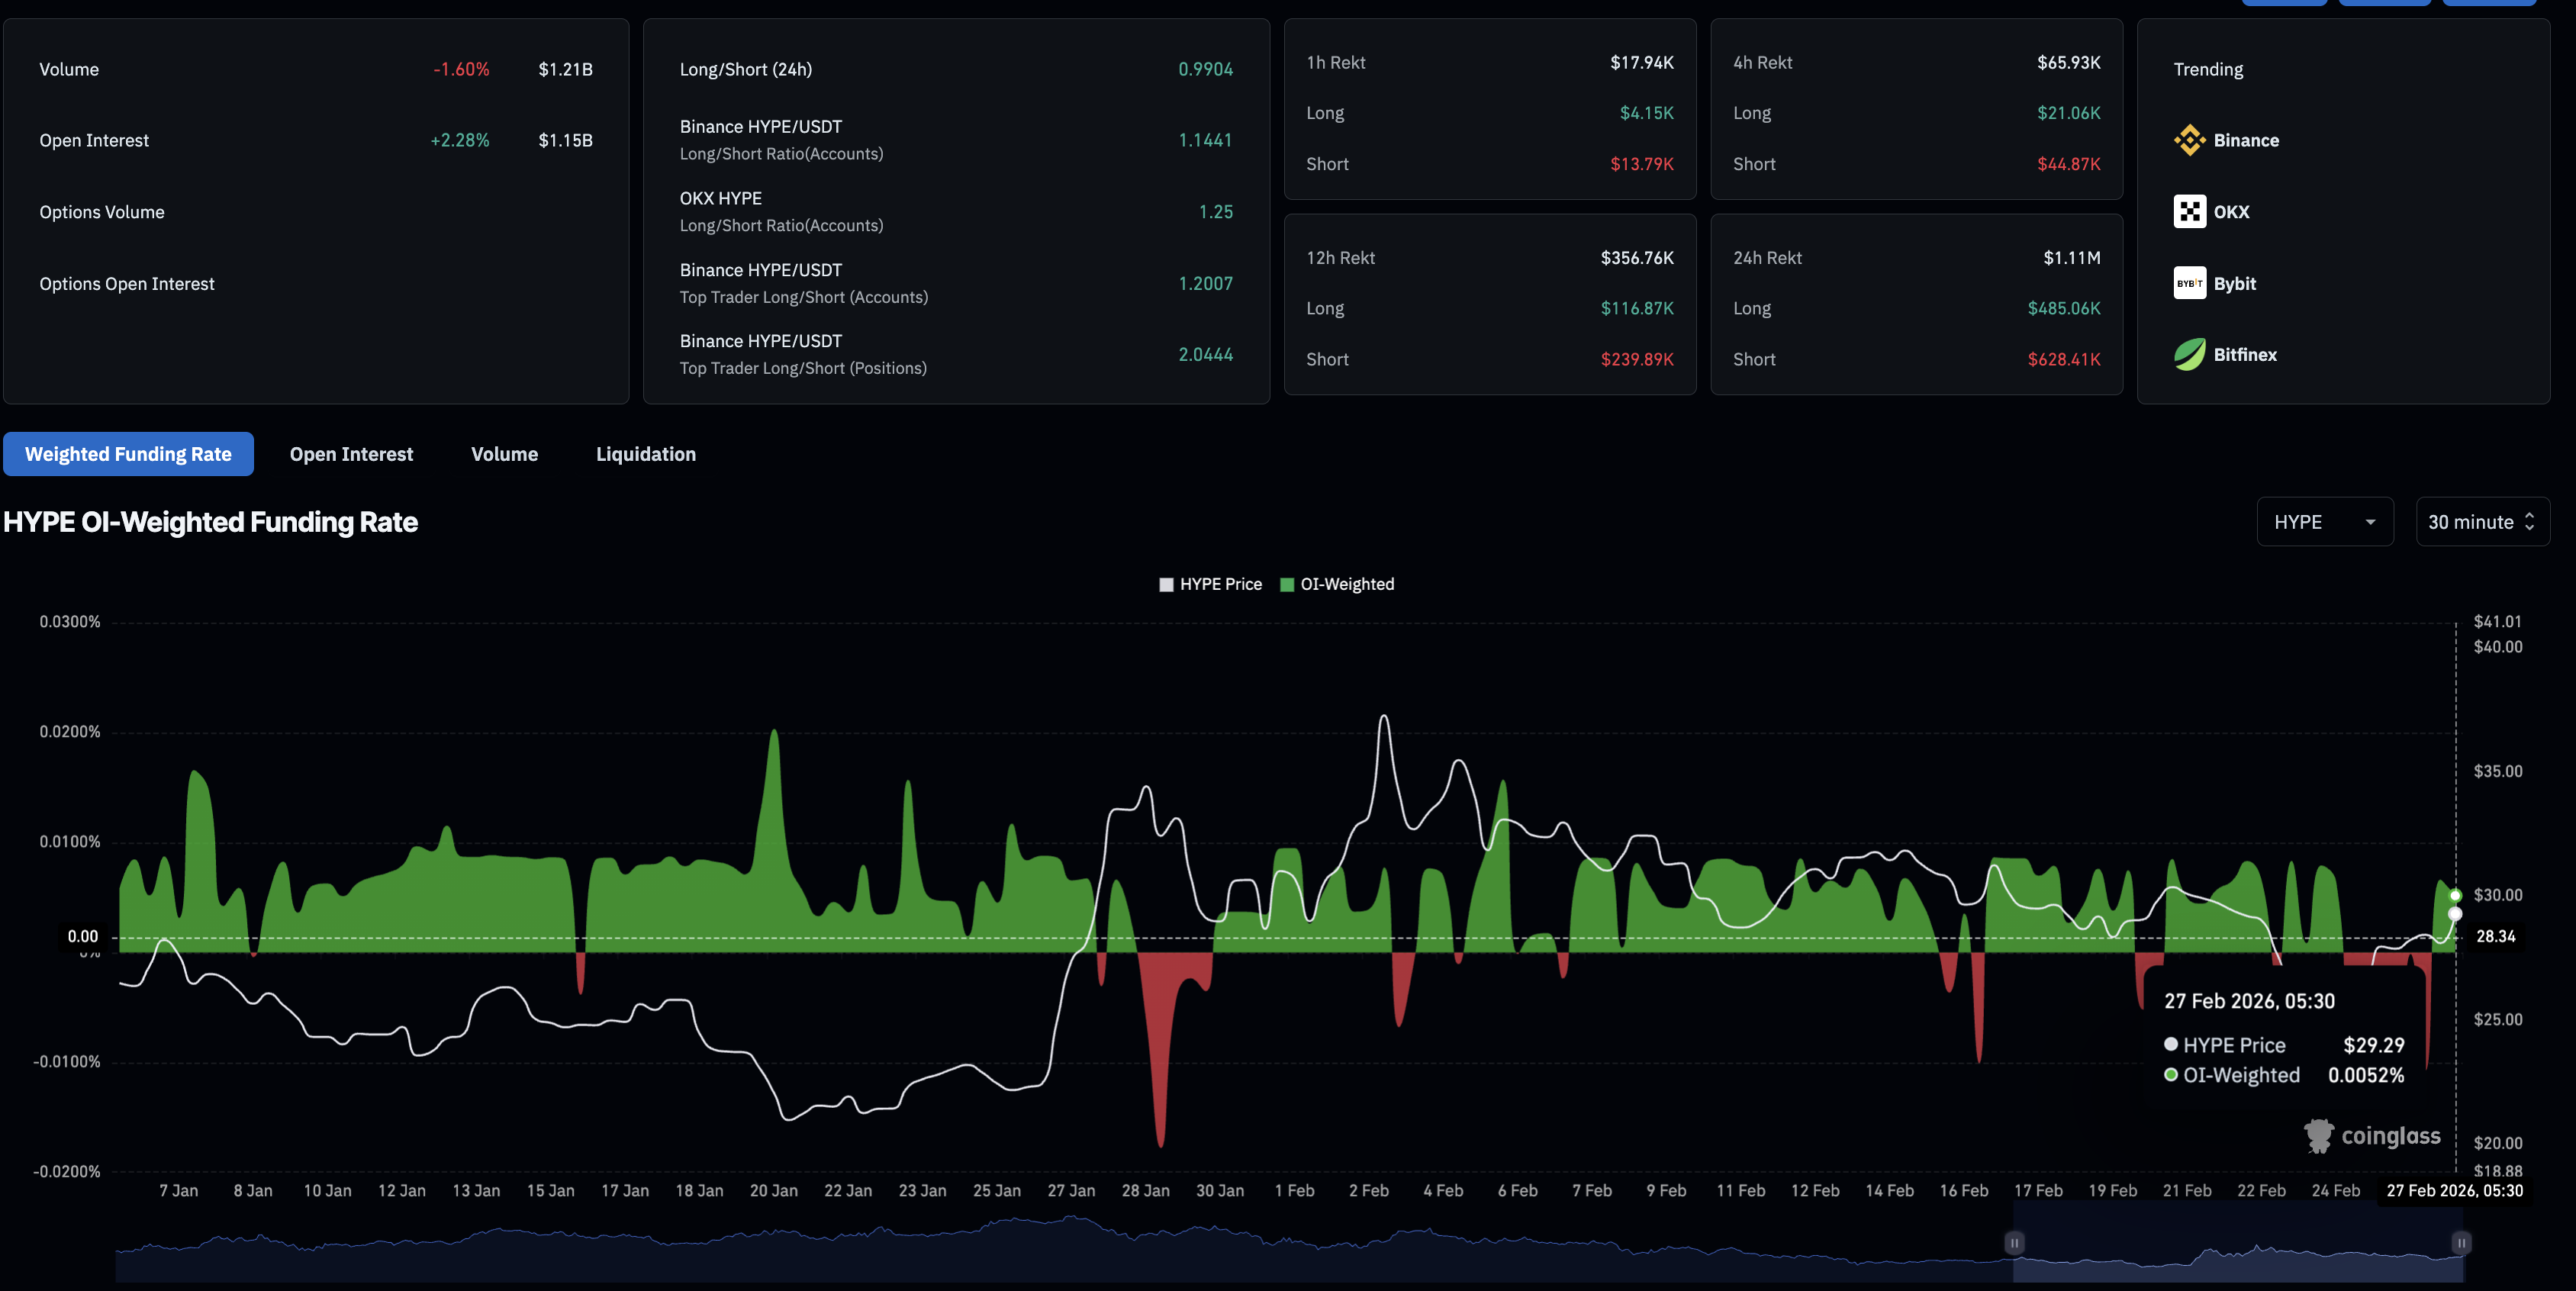
- Increasing Open Interest and funding rate suggest recovering retail strength.
- The technical outlook for HYPE points to a bullish shift, with the upside breakout of a falling channel pattern.

Hyperliquid (HYPE) approaches the $30 mark with 5% gains at press time on Friday. Retail interest in the perpetuals-focused Decentralized Exchange (DEX) token is rising, evidenced by capital inflow into the HYPE derivatives contracts. The technical outlook for Hyperliquid points to a bullish shift, as it rises above its 200-period Exponential Moving Average (EMA) on the 4-hour chart at $29.09 with a breakout of a falling channel pattern.
Hyperliquid regains retail strength
CoinGlass data shows the HYPE futures Open Interest (OI) is at $1.15 billion, up more than 2% over the past 24 hours. Typically, an increase in OI reflects a positional buildup, suggesting increased retail interest. The funding rate is at 0.0052%, indicating that traders are aligned to hold long positions, implying a bullish bias in the positional buildup.
Technical outlook: Will HYPE extend gains above $35?
After falling over 9% on Monday, Hyperliquid extends a steady four-day rebound from the S2 Pivot Point on the 4-hour chart at $25.72. At the time of writing, the HYPE token is up 5% on Friday, flipping Monday's loss to overall weekly gains of roughly 2% so far.
Hyperliquid trades above the 50-period and 200-period Exponential Moving Averages (EMAs) on the 4-hour logarithmic chart, signaling an increase in upside pressure. The DEX token recovery marks the breakout of a falling channel pattern as it exceeds the descending trendline resistance, reinforcing the near-term bullish bias.
The immediate resistance for HYPE lies at the R1 and R2 Pivot Point at $31.04 and $33.06, respectively.
The Moving Average Convergence Divergence (MACD) rises into positive territory on the 4-hour timeframe as the histogram expands above the zero line, suggesting a steady increase in bullish momentum after the breakout. Meanwhile, the Relative Strength Index (RSI) at 64 on the same chart hovers above the midline, pointing upward, reflecting heightened buying pressure but leaving further upside to reach the overbought zone.
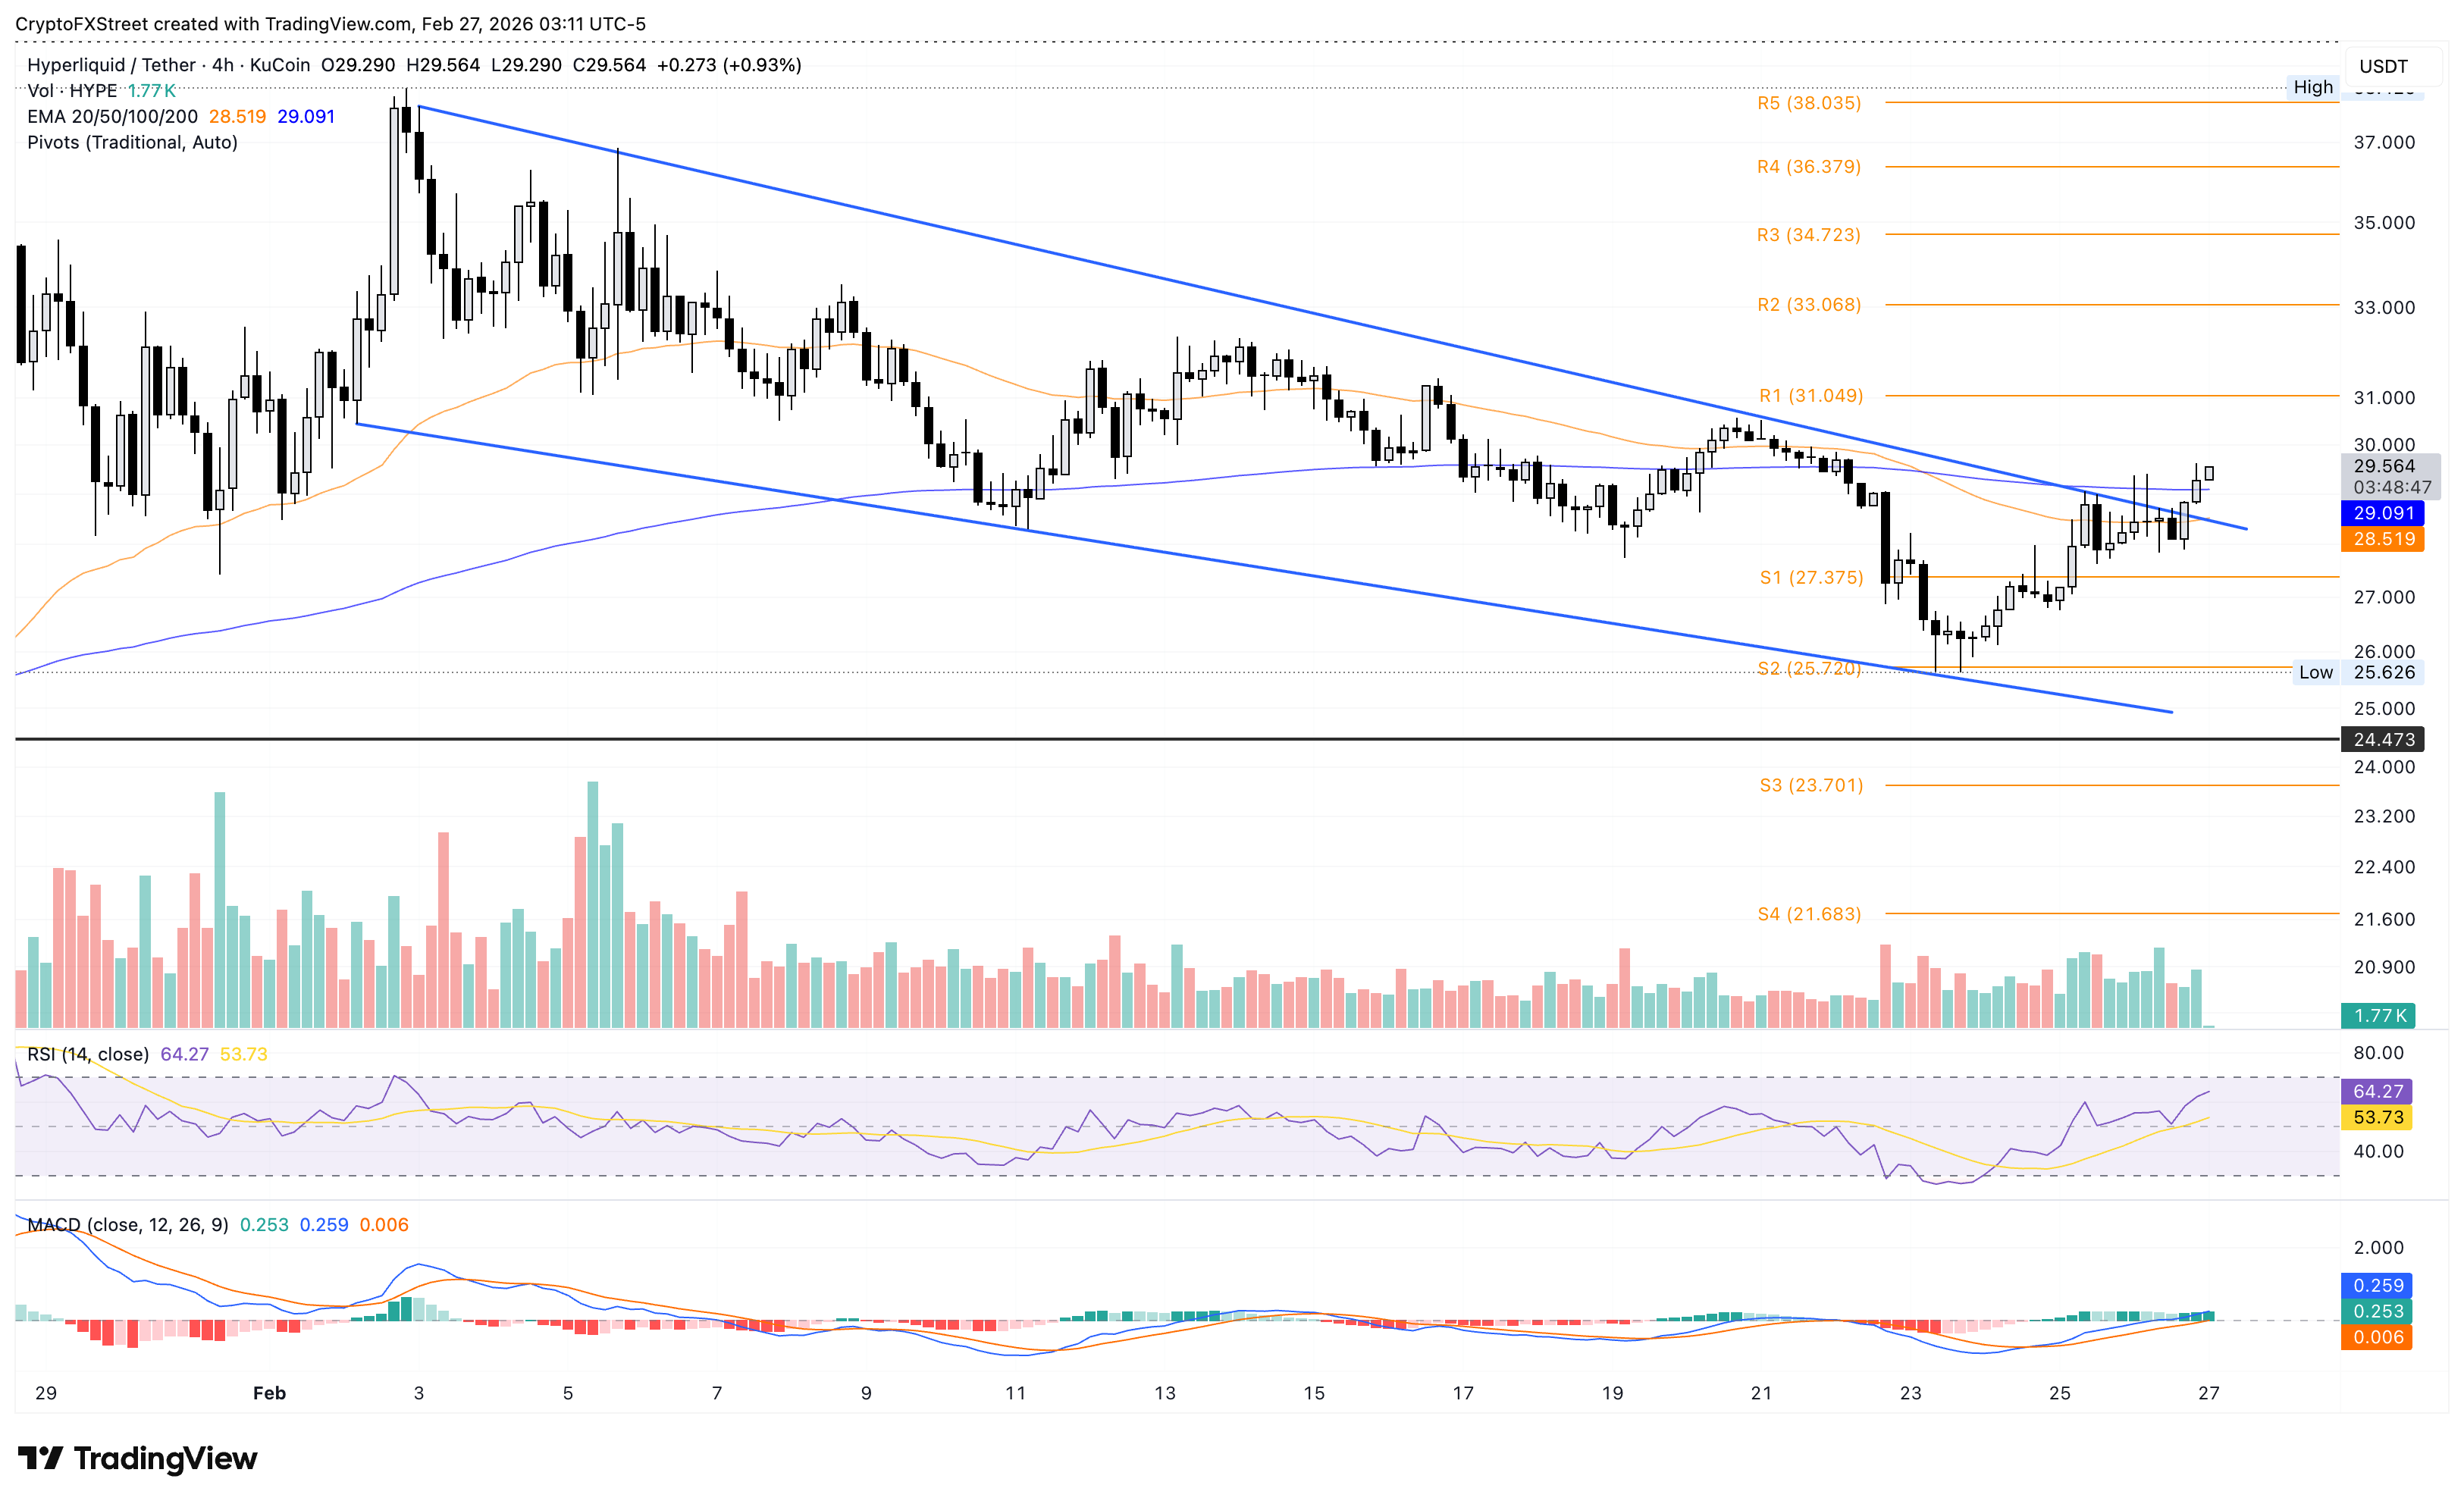
On the downside, the 50-period EMA at $28.50, aligning with the broken trend-line area, followed by a deeper support zone near the S1 Pivot Point at $27.37, could hold HYPE if selling pressure extends.
(The technical analysis of this story was written with the help of an AI tool.)
Author

Vishal Dixit
FXStreet
Vishal Dixit holds a B.Sc. in Chemistry from Wilson College but found his true calling in the world of crypto.



