|

NEO/USD Elliott Wave technical analysis [Video]

NEO/USD Elliott Wave technical analysis

  • Function: Counter-Trend.

  • Mode: Corrective.

  • Structure: Zigzag.

  • Position: Wave ((C)).

  • Direction (next higher degree): Wave Y.

  • Wave invalidation level:

  • Details: The correction follows a WXY pattern, which concluded around 8.688 USD.

NEO/USD trading strategy

The correction pattern, a WXY structure, reached its completion near 8.688 USD.

  • Major Resistance: 15.414 USD (Bullish Level) → A confirmed breakout at this level indicates the start of an uptrend.

Trading strategies

Long strategy:

  • Aggressive Entry: Buy within the 9.988 - 8.688 USD range if a reversal signal appears.

  • Breakout Entry: Enter a buy position if the price breaks through 15.414 USD with strong volume.

Risk management:

  • Invalidation Point: Exit the position if the price falls below 8.688 USD.
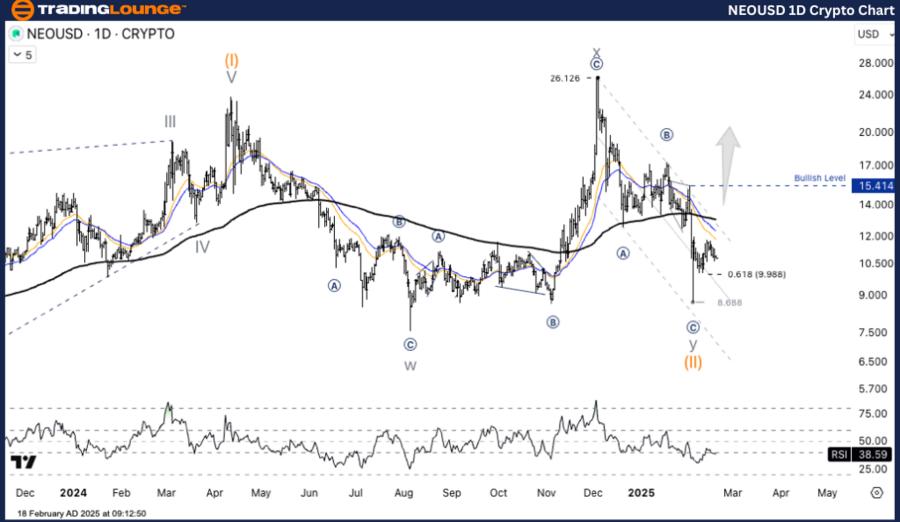
NEO

NEO/USD daily chart

NEO/USD Elliott Wave technical analysis

  • Function: Counter-Trend.

  • Mode: Corrective.

  • Structure: Zigzag.

  • Position: Wave ((C)).

  • Direction (next higher degree): Wave Y.

  • Wave invalidation level: 

  • Details: Currently in a Wave (2) correction, with Fib 0.618 support at 9.988 USD.

NEO/USD trading strategy

The correction follows a WXY pattern, which has concluded around 8.688 USD.

  • Major Resistance: 15.414 USD (Bullish Level) → A confirmed breakout at this level signals an uptrend continuation.

Trading strategies

Long strategy:

  • Aggressive Entry: Buy within 9.988 - 8.688 USD if a reversal signal emerges.

  • Breakout Entry: Enter a buy position once the price surpasses 15.414 USD with strong volume.

Risk management:

  • Invalidation Point: Exit the trade if the price drops below 8.688 USD.
NEO

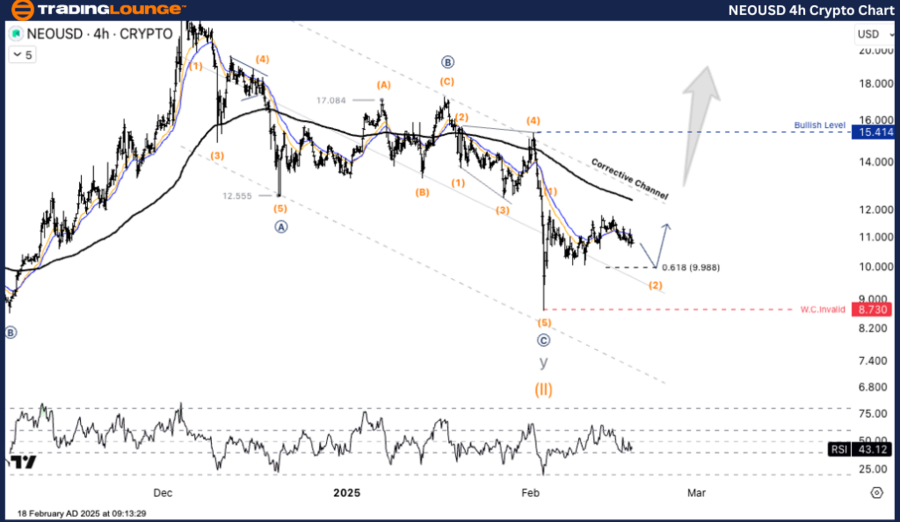
NEO/USD four-hour chart

NEO/USD Elliott Wave technical analysis [Video]

Author

Peter Mathers

Peter Mathers

TradingLounge

Peter Mathers started actively trading in 1982. He began his career at Hoei and Shoin, a Japanese futures trading company.

More from Peter Mathers
Share:

Editor's Picks

Bitcoin Cash trades lower, risks dead-cat bounce amid bearish signals

Bitcoin Cash (BCH) trades in the red below $522 at the time of writing on Tuesday, after multiple rejections at key resistance. BCH’s derivatives and on-chain indicators point to growing bearish sentiment and raise the risk of a dead-cat bounce toward lower support levels.

Pump.fun Price Forecast: PUMP weakens amid 10 billion token unlock, low retail interest

Pump.fun (PUMP) edges lower by roughly 2% at the time of writing on Tuesday, extending Monday’s 4% drop. The launchpad token remains at downside risk as 10 billion PUMP will unlock on Tuesday, while retail interest is declining.

Hyperliquid Price Forecast: HYPE consolidates as traders show mixed sentiment

Hyperliquid (HYPE) price is trading sideways at the time of writing on Tuesday, reflecting market indecision as traders await a clearer directional signal. The derivatives data further supports this mixed sentiment, with rising short bets while funding rates remain positive. 

Top Crypto Gainers: World Liberty Financial, MemeCore and Quant gain momentum

World Liberty Financial, MemeCore, and Quant are leading gains over the last 24 hours as the broader cryptocurrency market stabilizes after last week’s correction. Still, the technical outlook for altcoins remains mixed due to prevailing downside pressure and vulnerable market sentiment. 

Bitcoin Price Annual Forecast: BTC holds long-term bullish structure heading into 2026

Bitcoin (BTC) is wrapping up 2025 as one of its most eventful years, defined by unprecedented institutional participation, major regulatory developments, and extreme price volatility.

Bitcoin: The worst may be behind us

Bitcoin (BTC) price recovers slightly, trading at $65,000 at the time of writing on Friday, after reaching a low of $60,000 during the early Asian trading session. The Crypto King remained under pressure so far this week, posting three consecutive weeks of losses exceeding 30%.