MATIC price refuses to stay down, Polygon overcomes weakness with 175% rebound
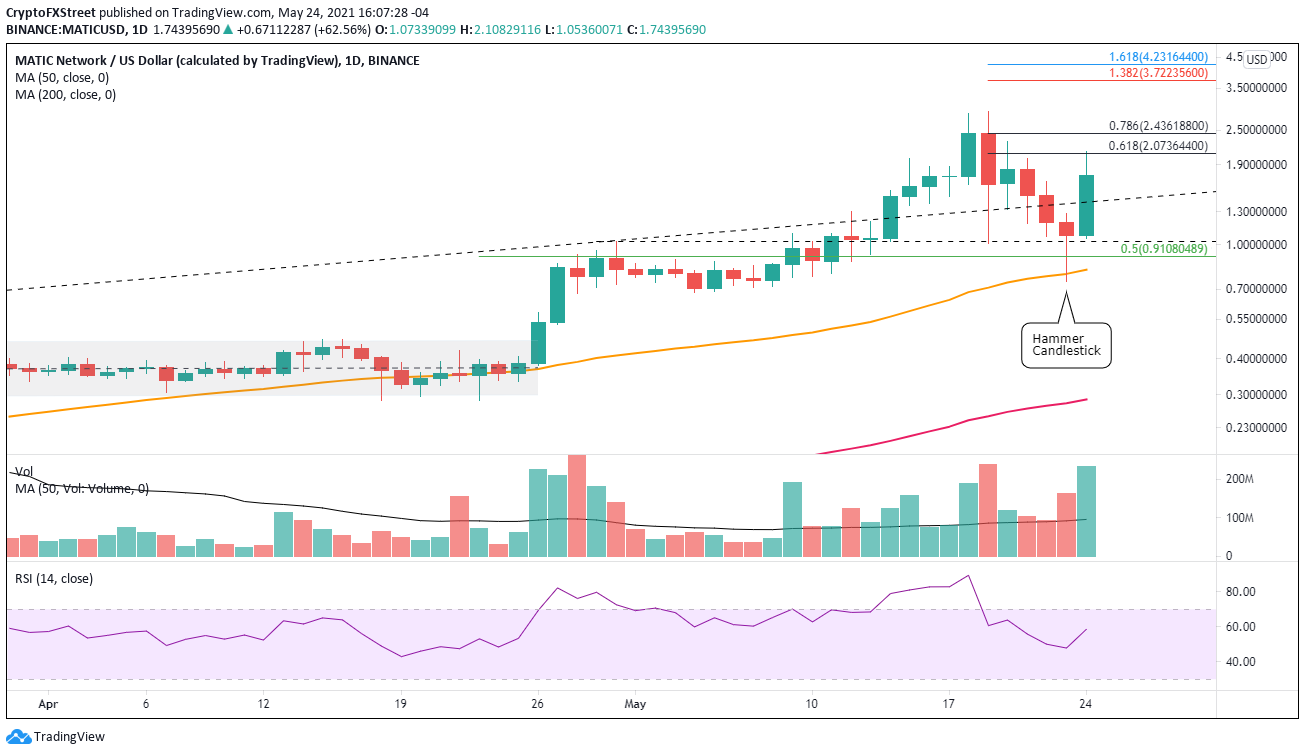
- MATIC price triggers bullish hammer candlestick pattern today and climbs almost 90%.
- Weekly Relative Strength Index (RSI) no longer shows an extreme overbought condition.
- A close above topside trend line confirms yesterday’s low at $0.74.

MATIC price suffered a 74% decline from the May 19 high to yesterday’s low, putting the digital token among the biggest decliners during last week’s crypto crash. Yet, the significant decline has not undermined the solid technical structure of the charts and still asserts Polygon to be one of the leaders for the next leg higher in the cryptocurrency complex.
MATIC price silences catastrophic voices
Polygon was one of the hardest hit by the recent market crash, going from $2.89 to $0.74 over five days, yielding a 74% loss for investors. Since yesterday’s low MATIC price has aggressively rallied, lifting the cryptocurrency 175% at today’s high, easily the best gain in the last 20 hours.
At yesterday’s low, MATIC price had fallen below the May 19 low at $1.01, the 50% retracement of the April-May rally at $0.91 and slightly undercut the 50-day simple moving average (SMA) at $0.79 before rebounding to close above the May 19 low with a bullish hammer candlestick pattern.
Today, MATIC price rose above the hammer candlestick pattern at $1.28 and rallied 90% before stalling around the psychologically important $2.00, a level that was temporary resistance on May 15. Polygon rests about 60% from the all-time high at $2.68 and dominates the crypto leaderboard for major tokens at time of writing.
MATIC price must close today above the topside trend line, beginning at the March high and running through the April high at $1.40. A failure to close above would designate today as a bull trap and leave Polygon exposed to again test the 50-day SMA at $0.82.
Upside targets begin with the 78.6% retracement of the May crash at $2.43, followed closely by the all-time high at $2.89. MATIC price may extend gains to the 138.2% extension of the May crash at $3.72 and $4.23, the 161.8% extension, before executing a new corrective process.
MATIC/USD daily chart
Despite Polygon’s compelling fundamental story as a fast-growing blockchain project that helps developers build decentralized applications compatible with Ethereum’s network, MATIC price is equally vulnerable to the swings in the cryptocurrency market. A failure to hold yesterday’s low at $0.74 leaves MATIC price exposed to a decline to the low of the early May consolidation at $0.68.
Author

Sheldon McIntyre, CMT
Independent Analyst
Sheldon has 24 years of investment experience holding various positions in companies based in the United States and Chile. His core competencies include BRIC and G-10 equity markets, swing and position trading and technical analysis.


