MATIC Price Forecast: Polygon poised to lead altcoins higher once selling subsides
- MATIC price holds topside trend line during a day of widespread selling in the cryptocurrency complex.
- Polygon weekly Relative Strength Index (RSI) index still shows an extreme overbought condition.
- Digital token ranks as the 17th largest cryptocurrency by market capitalization.

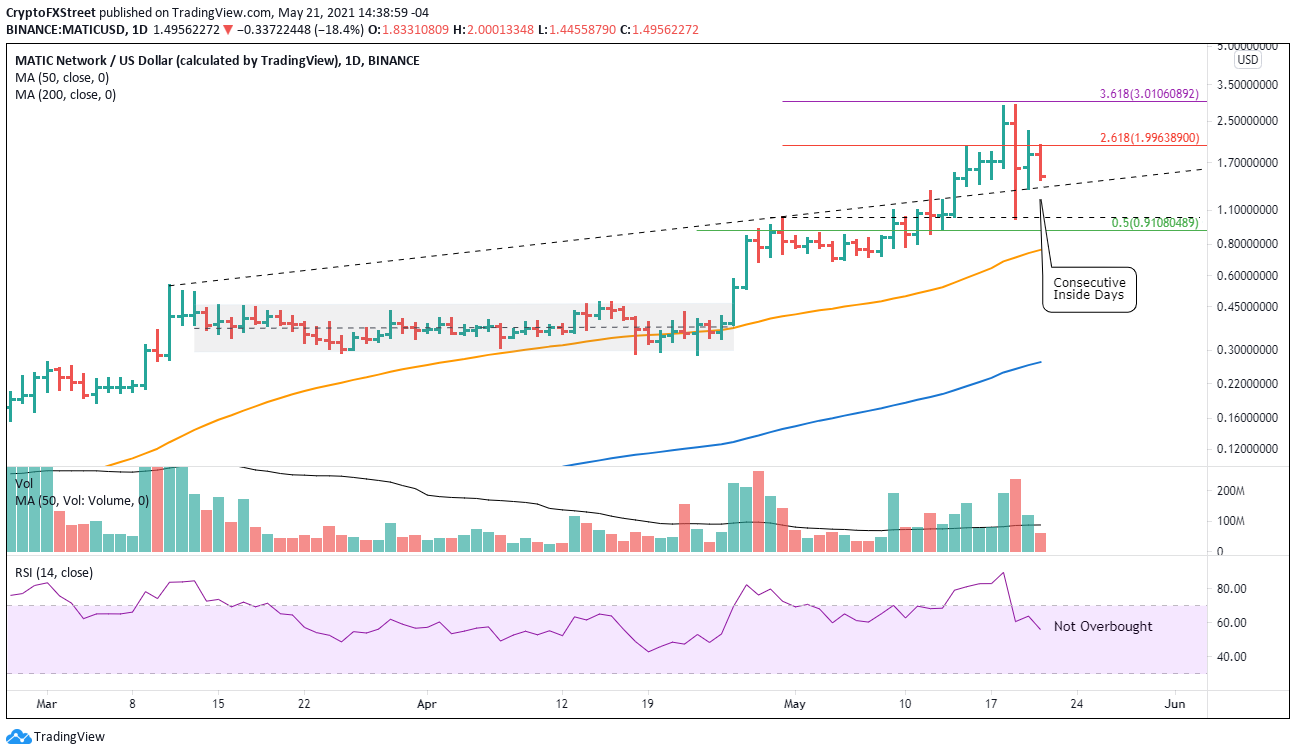
MATIC price is on pace to close with consecutive inside days on the bar chart, solidifying the rebound above the topside trend line. Polygon will see spurts of buying and selling pressure, but it is critical to hold key support levels on a daily and weekly closing basis. For now, the upside is limited, but the digital token is technically well-positioned to lead the crypto market higher in the months ahead.
MATIC price consolidation hides new opportunities
MATIC price sustained a significant intra-day collapse on May 19, but the altcoin rebounded from a 60% loss to close with a 33% loss. The decline ended the tremendous rally for Polygon from April 26 to May 19, but it does not alter the underlying fundamental momentum behind the Ethereum scaling solution.
The strength of MATIC price is visible on the daily chart as Polygon did not even touch the 50-day simple moving average (SMA) at the peak of the selling; instead, it held the April 30 consolidation high at $1.02 before closing above the tactically important topside trend line. Moreover, Polygon bottomed before the 50% retracement of the April-May advance at $0.91.
The sell-off did alleviate the overbought condition on the daily RSI. Still, the weekly RSI has barely budged from extreme levels, suggesting that new highs for MATIC price could be limited until the RSI declines below overbought levels.
MATIC price is an outlier in technical positioning. However, the short-term outlook is neutral until the broader weakness in the crypto market subsides, and bellwether digital tokens formalize superior support levels.
Upside momentum may be limited to the 261.8% Fibonacci extension of the early May correction at $1.99 on a daily closing basis. A bountiful rally for cryptocurrencies could release MATIC price to the all-time high at $2.89 very quickly, securing its place as the leader.
MATIC/USD daily chart
Current market conditions remain tenuous at the moment, and renewed selling pressure could emerge. A daily close below the topside trend line would be the first signal that MATIC price could test the May 19 low at $1.01 and potentially fall to the 50% retracement. Heavy selling could drive Polygon down to the 50-day SMA at $0.76 before a firm low is established.
In a fluid investing environment, investors should target relative strength leaders such as Polygon and use the technical levels mentioned above to trade against.
Author

Sheldon McIntyre, CMT
Independent Analyst
Sheldon has 24 years of investment experience holding various positions in companies based in the United States and Chile. His core competencies include BRIC and G-10 equity markets, swing and position trading and technical analysis.


