Aster lags recovery as perpetual DEX releases new roadmap on infrastructure, utility and ecosystem
- Aster trades below the 50, 100, and 200-EMAs on the 4-hour chart, as bulls struggle to retain control.
- Aster's new roadmap focuses on building foundational engines, including infrastructure, token utility and the ecosystem.
- Aster Chain L1 will launch in the first quarter of 2026, with staking capability expected in the second quarter.

Aster (ASTER) is consolidating above $1.05 at the time of writing on Thursday, reflecting lethargic sentiment in the broader cryptocurrency market. The token native to the perpetual Decentralised Exchange (DEX) had recovered from Monday's low of $0.88 but stalled around $1.08 on Wednesday.
Aster eyes Layer-1 blockchain launch and staking in 2026
Aster released a new roadmap on Thursday that focuses on building the protocol's foundational engines, including infrastructure, token utility, the ecosystem, and the community.
According to the roadmap's documentation, "Aster is evolving from a trading platform into a foundational layer of Decentralized Finance (DeFi)."
The network has lined up several product releases in December, including Shield Mode, which enables privacy trading with high leverage; Strategy Order, which will implement Time-Weighted Average Price (TWAP) to minimize slippage, and a real-world asset (RWA) upgrade, supporting more assets and deeper liquidity.
In the first quarter of 2026, Aster will launch a Layer-1 mainnet and the Aster Code, designed to support ecosystem builders. Still in Q1, Aster is expected to roll out on-ramp and off-ramp services in collaboration with third-party providers.
Aster Staking will debut in Q2, followed by Aster Governance, tailored to support ecosystem growth and long-term sustainability. Aster Smart Money feature will also debut in Q2, allowing users to follow top traders and share their live trades.
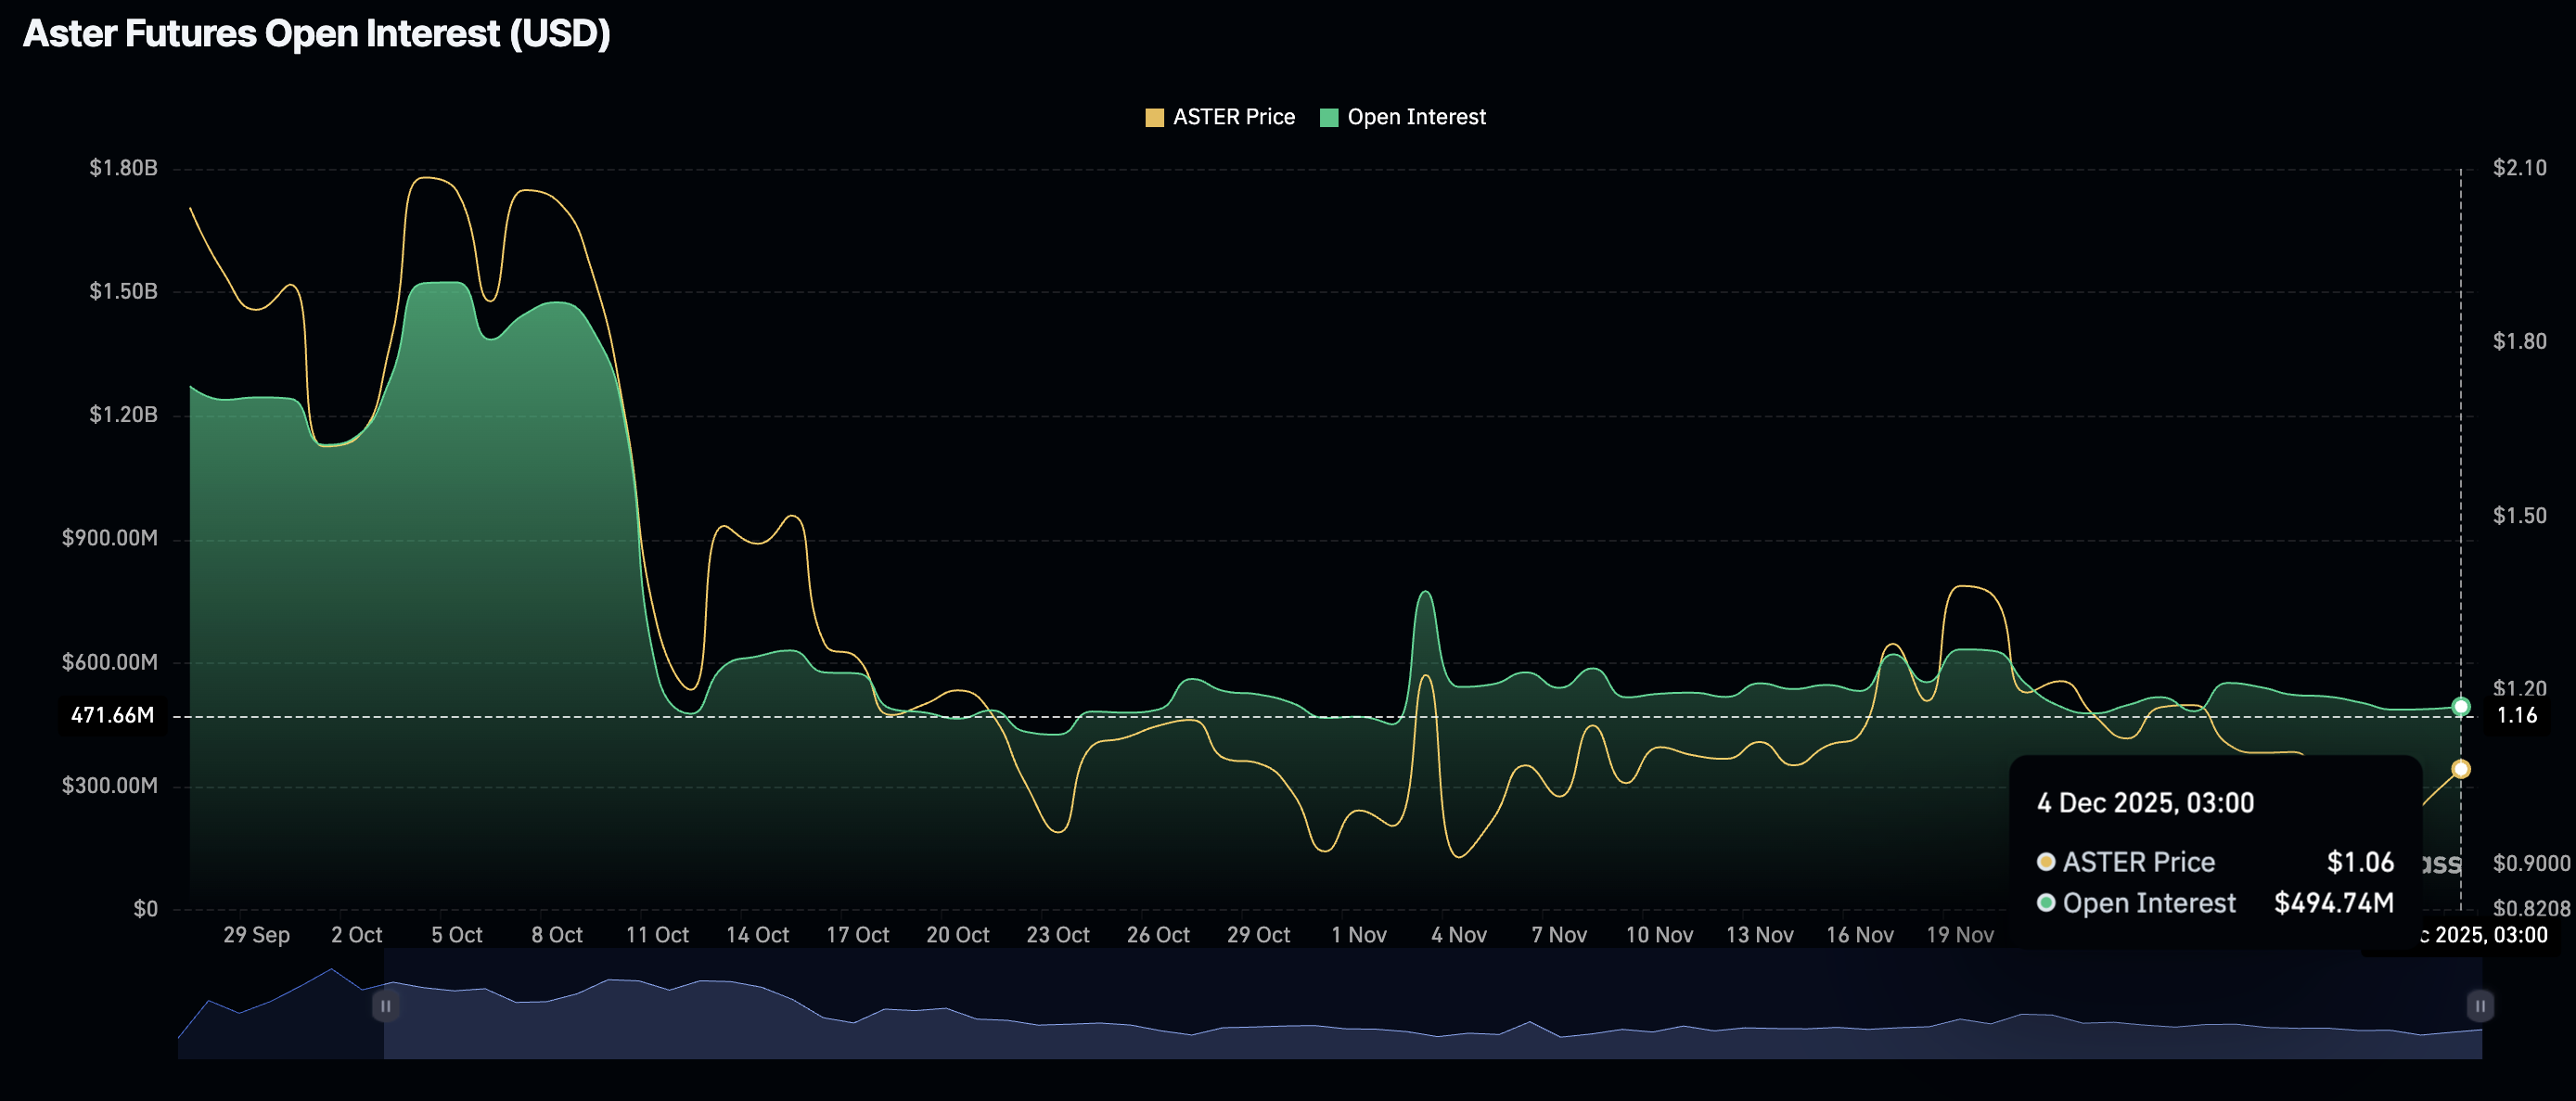
Despite the roadmap release, retail interest in ASTER remains relatively low, as evidenced by futures Open Interest (OI) averaging $495,000 on Thursday, down from $1.19 billion on October 10.
Technical outlook: Aster slides as overhead pressure swells
Aster is edging lower below the 50 Exponential Moving Average (EMA) at $1.06, the 100 EMA at $1.09 and the 200 EMA at $1.14 on the 4-hour chart. The Relative Strength Index (RSI) sits at 50 (neutral), which may close the day in the bearish region. A declining RSI toward oversold territory indicates increasing bearish momentum.
Although the Moving Average Convergence Divergence (MACD) indicator on the same chart remains above its mean line, it shows weakness and is likely to confirm a sell signal in upcoming sessions if bulls fail to repair the uptrend.
Traders will look for the blue MACD line crossing below the red signal line to validate the bearish thesis. An extended decline below the pivotal $1.00 level could push Aster toward Monday's low of $0.88.
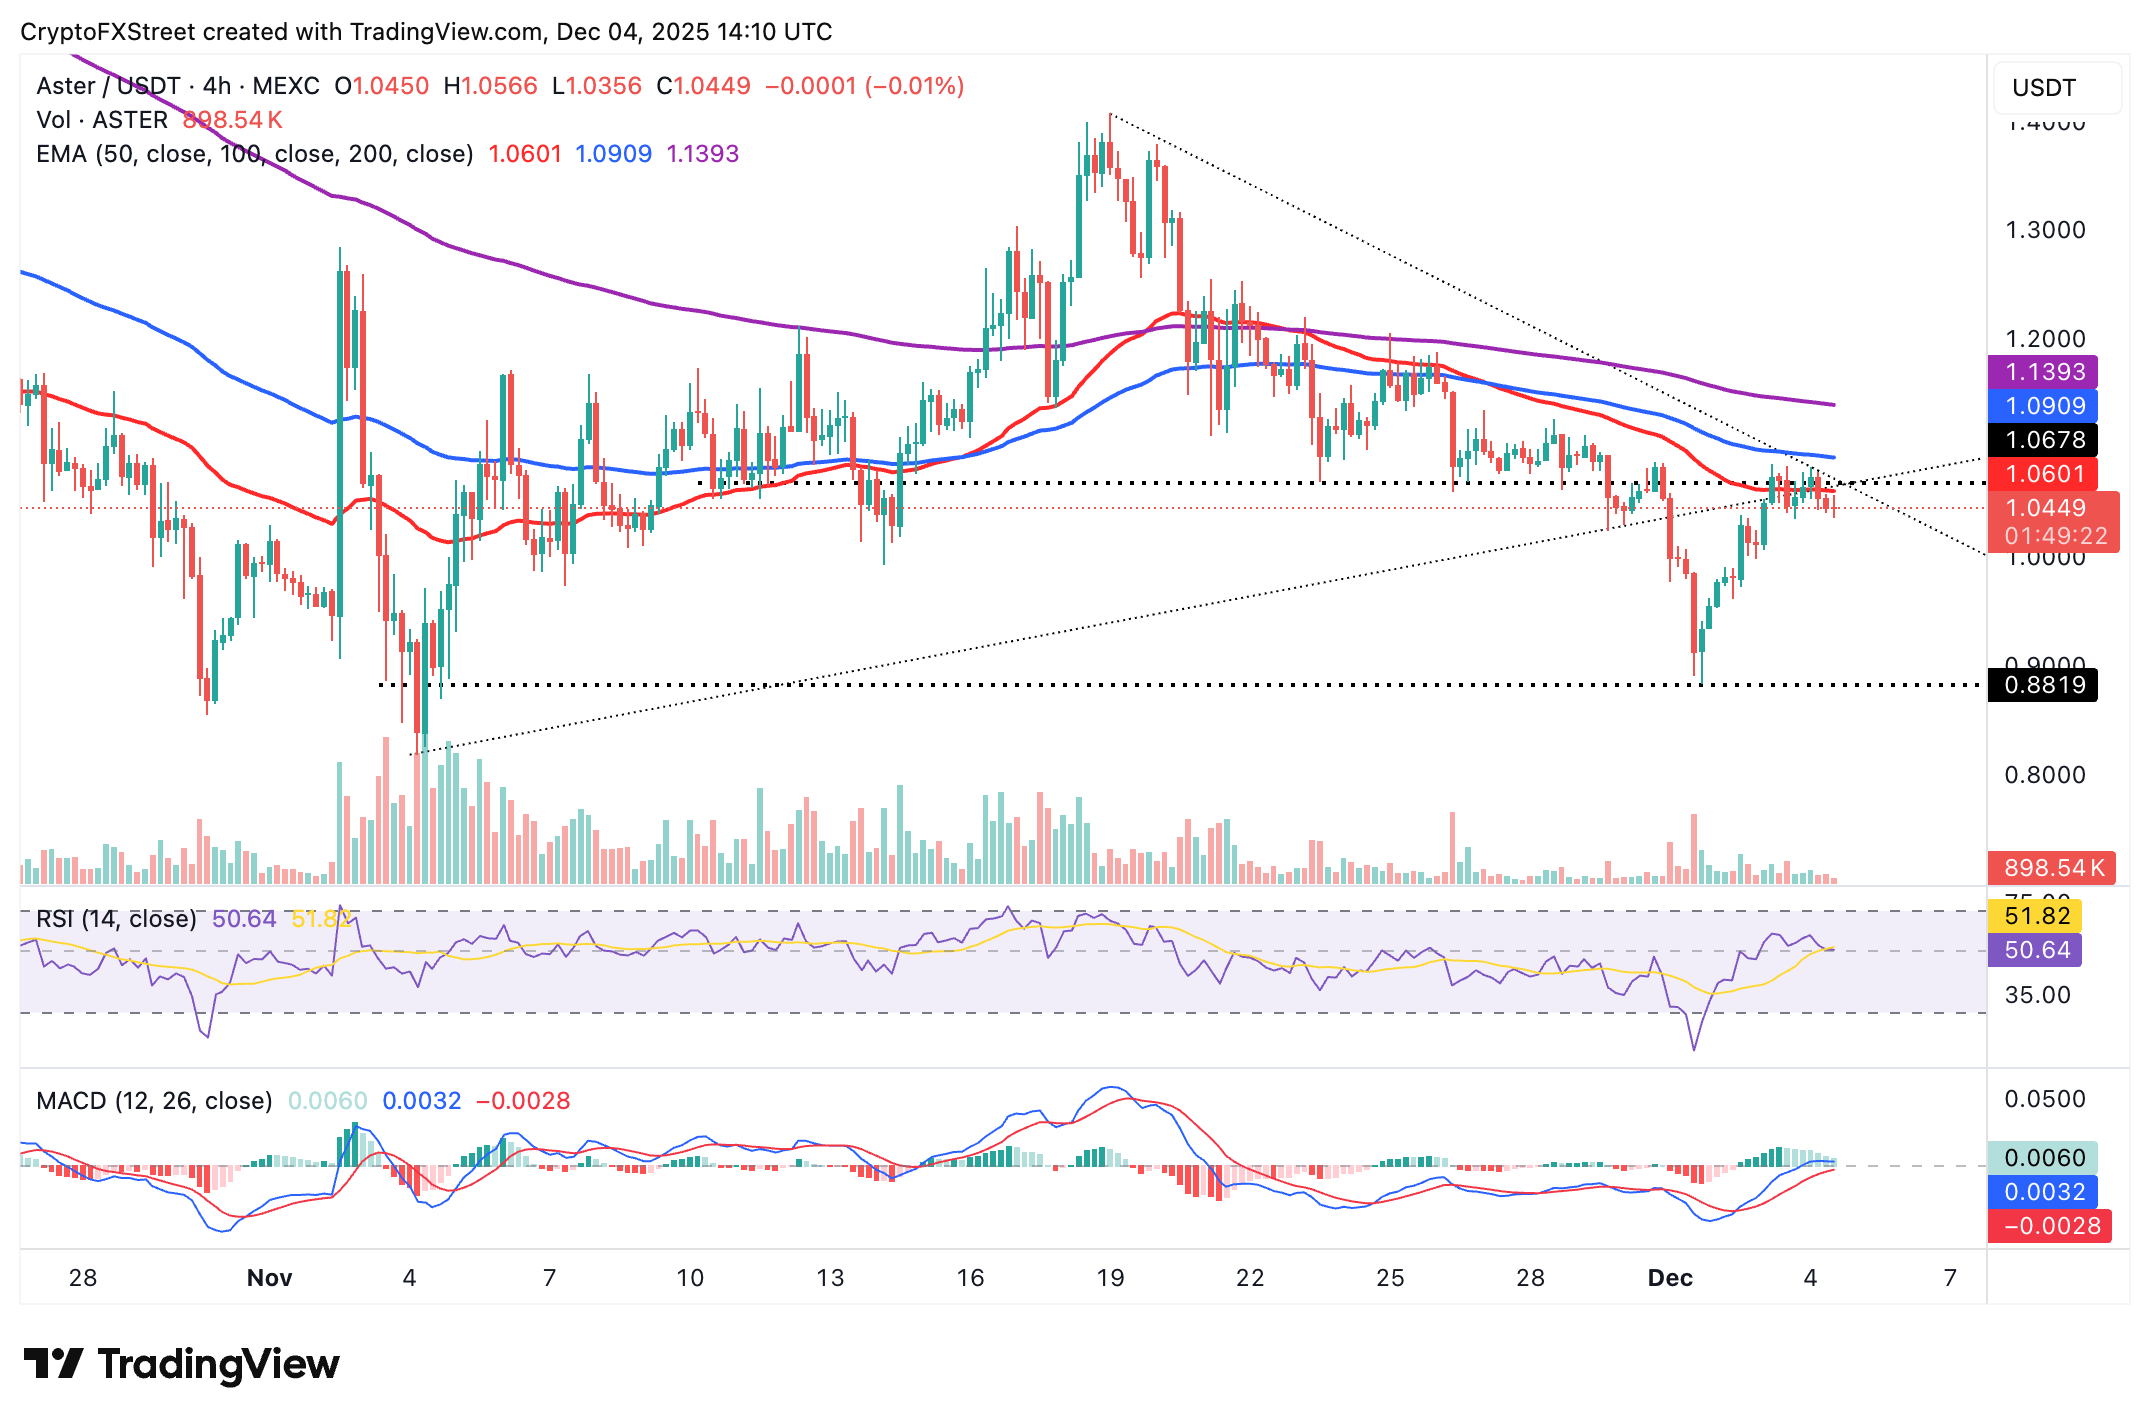
A break above the 50 EMA at $1.06 will maintain the bullish narrative. Other key areas of interest for traders are the 100 EMA at $1.09 and the 200 EMA at $1.14, which could cap rebounds.
Open Interest, funding rate FAQs
Higher Open Interest is associated with higher liquidity and new capital inflow to the market. This is considered the equivalent of increase in efficiency and the ongoing trend continues. When Open Interest decreases, it is considered a sign of liquidation in the market, investors are leaving and the overall demand for an asset is on a decline, fueling a bearish sentiment among investors.
Funding fees bridge the difference between spot prices and prices of futures contracts of an asset by increasing liquidation risks faced by traders. A consistently high and positive funding rate implies there is a bullish sentiment among market participants and there is an expectation of a price hike. A consistently negative funding rate for an asset implies a bearish sentiment, indicating that traders expect the cryptocurrency’s price to fall and a bearish trend reversal is likely to occur.
Author

John Isige
FXStreet
John Isige is a seasoned cryptocurrency journalist and markets analyst committed to delivering high-quality, actionable insights tailored to traders, investors, and crypto enthusiasts. He enjoys deep dives into emerging Web3 tren


