MATIC price is signaling a buying opportunity provided Bitcoin price falls below $29,000
- MATIC price indicators show that the altcoin has cooled from the 17% rally of July 13.
- The MVRV ratio also dipped below the neutral line, and falling further could suggest a bounce back in price is likely.
- The altcoin, however, shares a negative correlation with Bitcoin, which means that a short-term rise is possible even if BTC declines.

MATIC price recovery was in line with the rest of the market when the cryptocurrency posted over 40% gains in a month from mid-June. In the following days, red candlesticks took over the price action, erasing a significant chunk of the gains registered by the altcoin. Investors, however, might be able to spin this into a positive situation as accumulation at these price levels could lead to profits.
MATIC price hints at potential gains
MATIC price lost the support of the 50-day Exponential Moving Average (EMA), a key level bringing the market value of the altcoin to $0.708. At the time of writing, the Polygon token is down by 17% in the last 11 days, resulting in the price indicators flipping from bullish to bearish. However, they also hinted at what is to come.
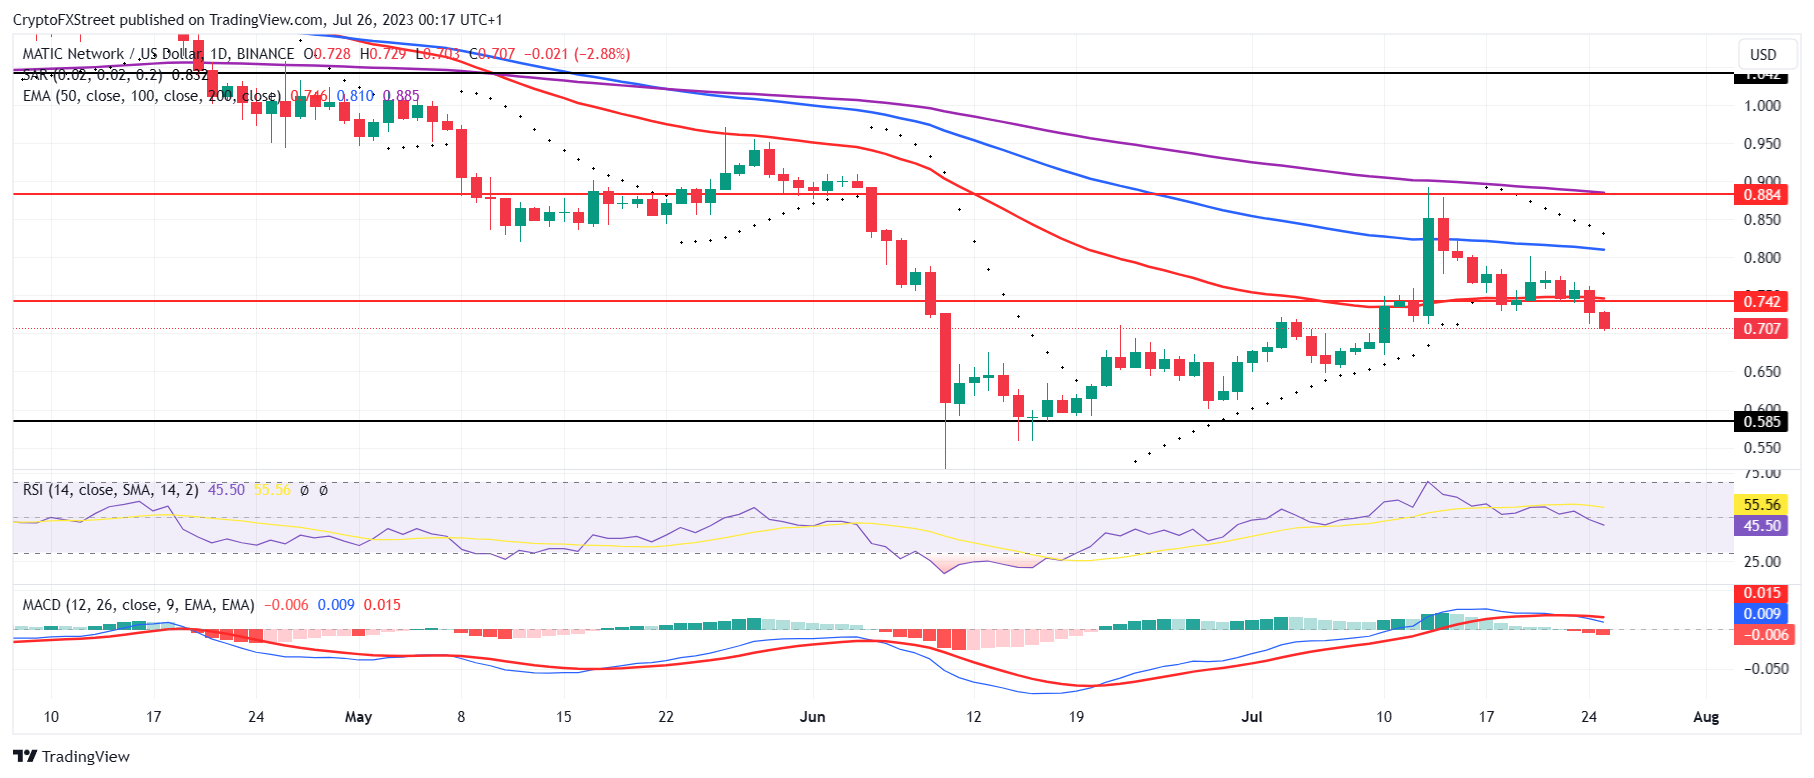
MATIC/USD 1-day chart
The Relative Strength Index (RSI) slipped below the neutral line at 50.0 after almost three weeks, which suggests a change in trend. But since it isn’t too far below, a flip of the neutral line into a support level would likely lead to the price bouncing back.
Similarly, the Moving Average Convergence Divergence (MACD) indicator also noted a bearish crossover in the last two days. This resulted in the histogram observing red bars, which suggests that the altcoin is now open to a change in momentum from bearish to bullish, provided the MACD line (blue) does not fall below the zero line.
Furthermore, the Market Value to Realized Value (MVRV) ratio, which measures the profitability of investors, fell below the neutral line too. While that is a negative sign, the 30-day ratio tends to suggest positive results when the indicator slips below -10%. Historically, this area, also known as the “opportunity zone,” leads to accumulation and change in trend, leading to a price recovery.
 [04.47.09, 26 Jul, 2023]-638259270852444736.png)
MATIC MVRV ratio
But this is where MATIC price might face some hurdles. The Polygon token shares a negative correlation with the leader of the cryptocurrencies - Bitcoin. The correlation between the two assets stands at -0.17, which means that the altcoin’s rise lies in Bitcoin price’s decline.
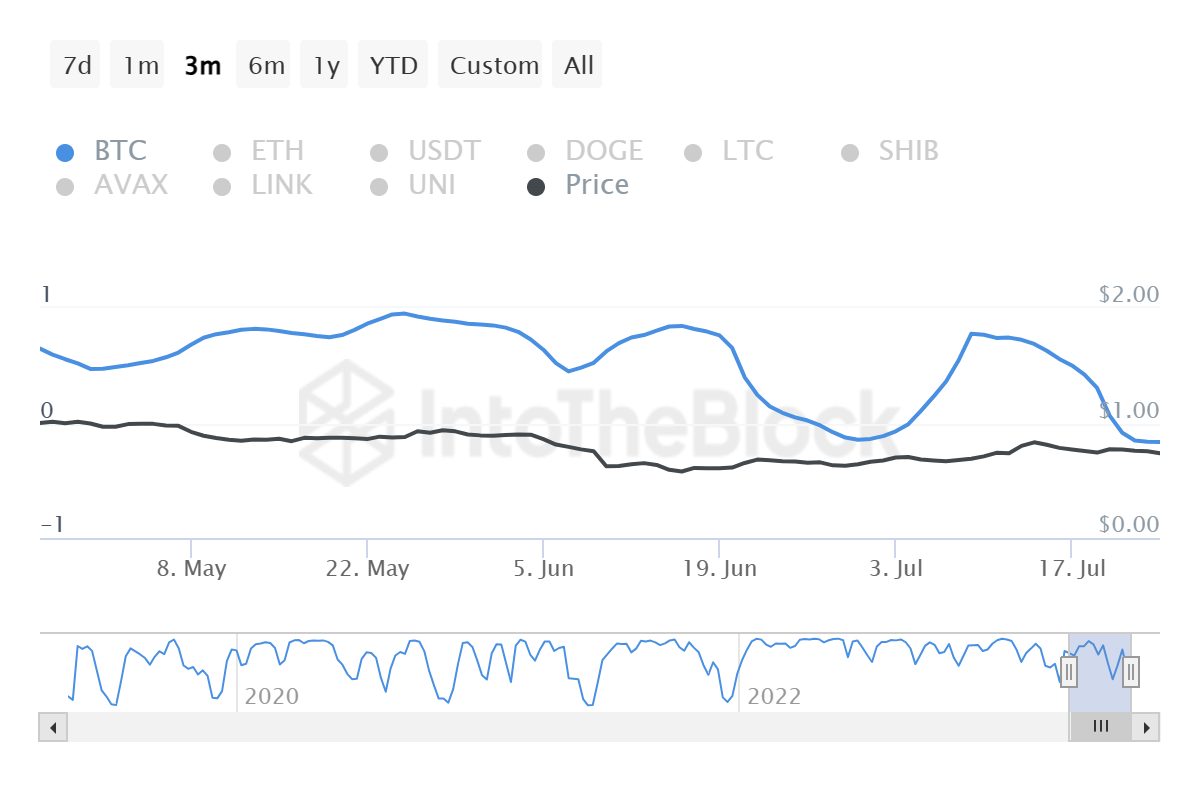
MATIC correlation with Bitcoin
So in the short term, if BTC was to slip below $29,000, MATIC might note some green candlesticks. Or if the correlation improves over the next few weeks, the altcoin will be following in Bitcoin’s footsteps.
Like this article? Help us with some feedback by answering this survey:
Author

Aaryamann Shrivastava
FXStreet
Aaryamann Shrivastava is a Cryptocurrency journalist and market analyst with over 1,000 articles under his name. Graduated with an Honours in Journalism, he has been part of the crypto industry for more than a year now.


