Major altcoins Cardano, Litecoin, Solana stabilize around key levels as bulls hint at a new leg higher
- Cardano price stabilizes around $0.74 on Wednesday after holding a key level the previous day.
- Litecoin approaches weekly resistance at $96.30, closing above could hint at a rally ahead.
- Solana price finds support around the daily level at $163.65 as bullish momentum mounts.

Major altcoins Cardano (ADA), Litecoin (LTC) and Solana (SOL) are showing signs of strength as these cryptos stabilize around key support levels, suggesting a new leg higher as bullish momentum mounts. ADA and SOL hold steady around $0.74 and $163.65, respectively, at the time of writing on Wednesday, while LTC approaches resistance at $96.30.
US President Donald Trump stepped in to revive momentum for crypto legislation in the US House of Representatives on early Wednesday, fueling optimism and bullish sentiment across the crypto market.
-1752654608125.png)
Cardano is poised for an upleg as it finds support around a key level
Cardano price broke above the June 11 high of $0.73 on Sunday, which roughly coincides with the 61.8% Fibonacci retracement at $0.72 (drawn from the May 12 high of $0.86 to the June 22 low of $0.51). ADA retested and rebounded, finding support around $0.73 in the next two days. At the time of writing on Wednesday, it stabilizes at around $0.74.
If the $0.73 support level holds, ADA could extend the rally toward its next daily resistance at $0.84.
The Relative Strength Index (RSI) indicator reads 72 on the daily chart, above its overbought level of 70, indicating bullish momentum. The Moving Average Convergence Divergence (MACD) showed a bullish crossover at the end of June. It also shows rising green histogram bars above its neutral zero line, suggesting that bullish momentum is gaining traction and continuing an upward trend.
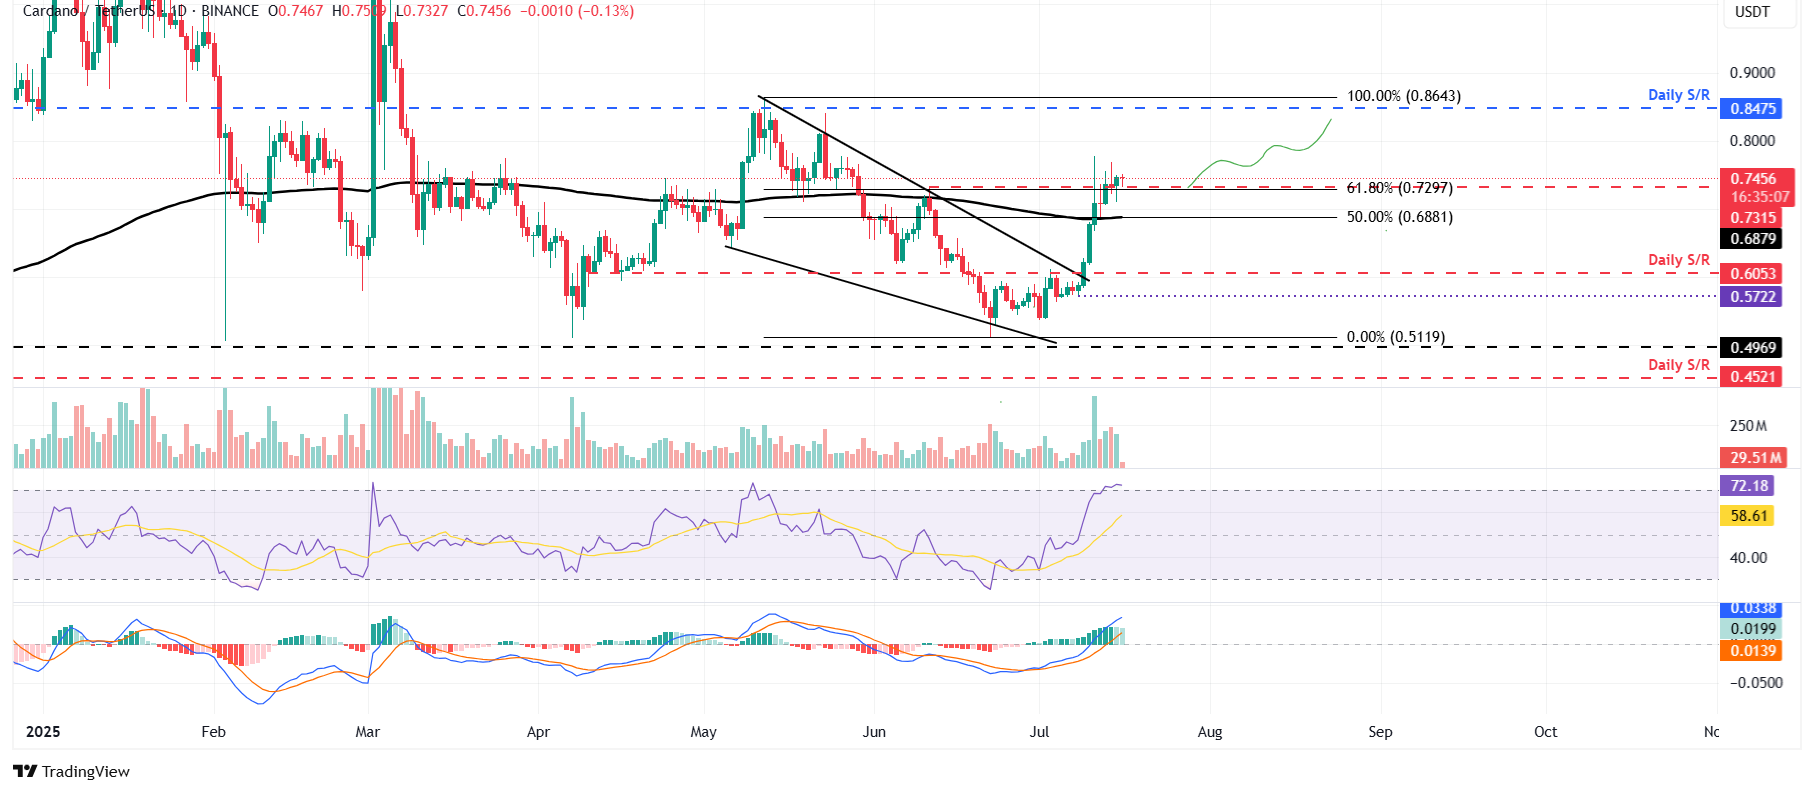
ADA/USDT daily chart
However, if ADA faces a correction and closes below the $0.73 support, it could extend the decline to find support around the 50% Fibonacci retracement at $0.68, which coincides with the 200-day Exponential Moving Average (EMA).
Litecoin could rally if it closes above $96.30 weekly resistance
Litecoin price broke above the 50% Fibonacci retracement at $91.61 (drawn from the May 10 high of $107.05 to the June 22 low of $76.17) and the 200-day EMA at $91.71 on June 10, but failed to close above the weekly resistance at $96.30 the next day. Since then, LTC has been consolidating within this range. At the time of writing on Wednesday, Litecoin price is nearing the weekly resistance at $96.30
If LTC breaks and closes above this level on a daily basis, it could extend the rally to retest the May 10 high of $107.05.
The RSI on the daily chart reads 65, which is above its neutral line but still below overbought conditions, indicating strong bullish momentum. The MACD showed a bullish crossover at the end of June, signalling a buy opportunity. It also shows rising green histogram bars above its neutral zero line, suggesting bullish momentum is gaining traction and continuing an upward trend.
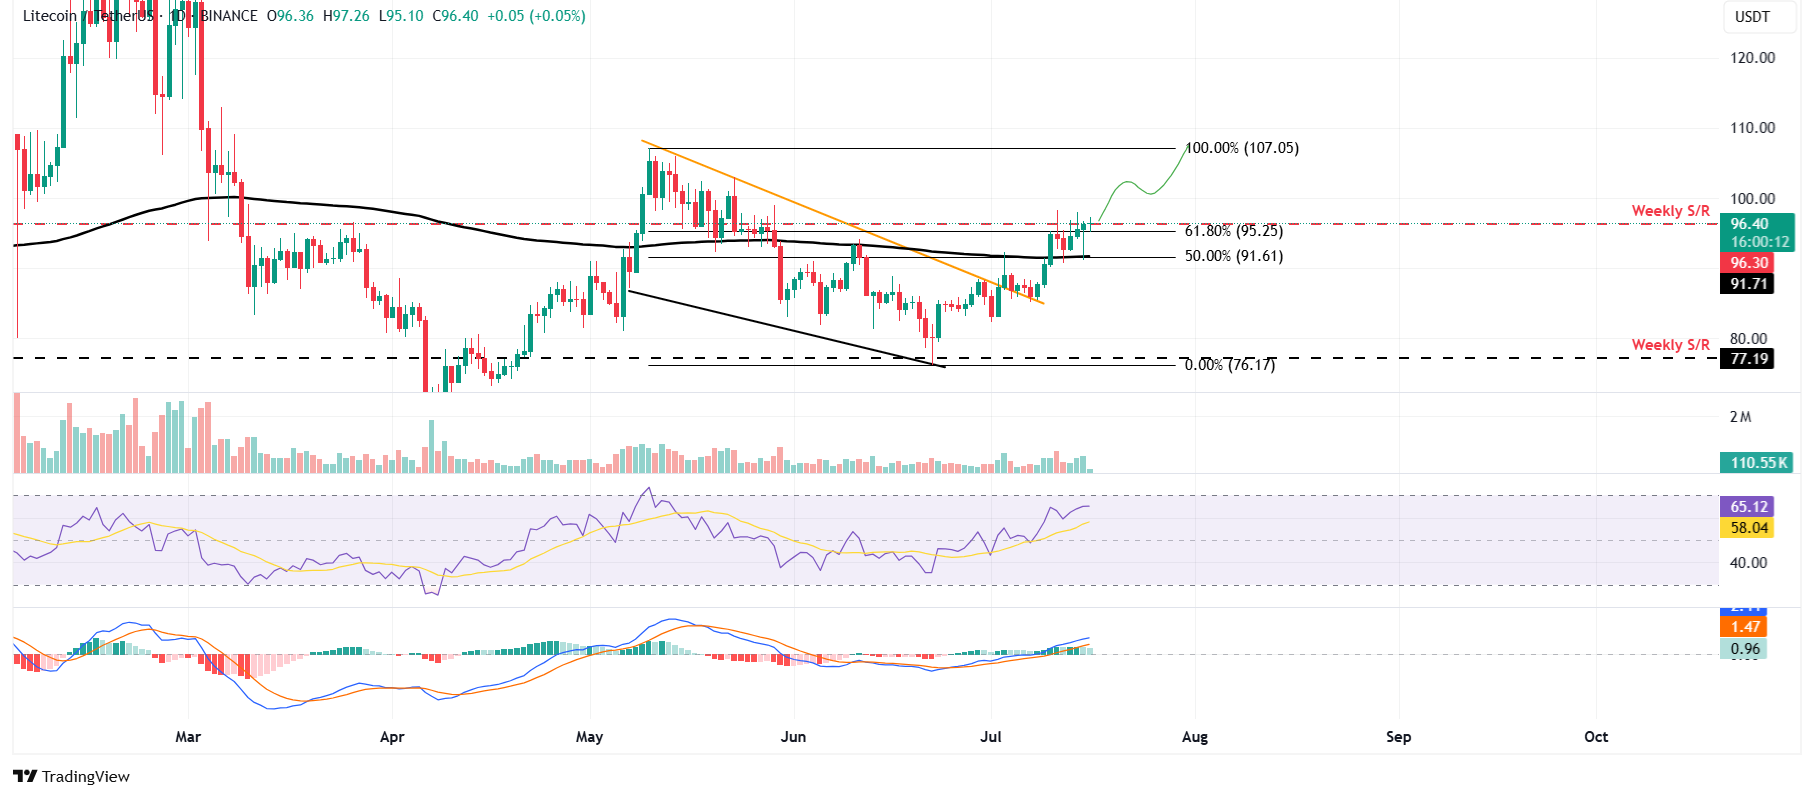
LTC/USDT daily chart
On the other hand, if LTC corrects, it could extend the decline to find support around the 200-day EMA at $91.71.
Solana could rally as bullish momentum builds
Solana price broke above its daily resistance at $160 on June 10 and declined in the next two days, finding support around this level. This daily level aligns with the 200-day EMA at $159.12, marking this as a key support area. At the time of writing on Wednesday, SOL continues to hold support and trades at $164.
If the $160 support level continues to hold, SOL could extend the rally toward its next daily resistance at $184.13.
Like Litecoin, Solana’s RSI and MACD indicators on the daily chart suggest bullish momentum is gaining traction.
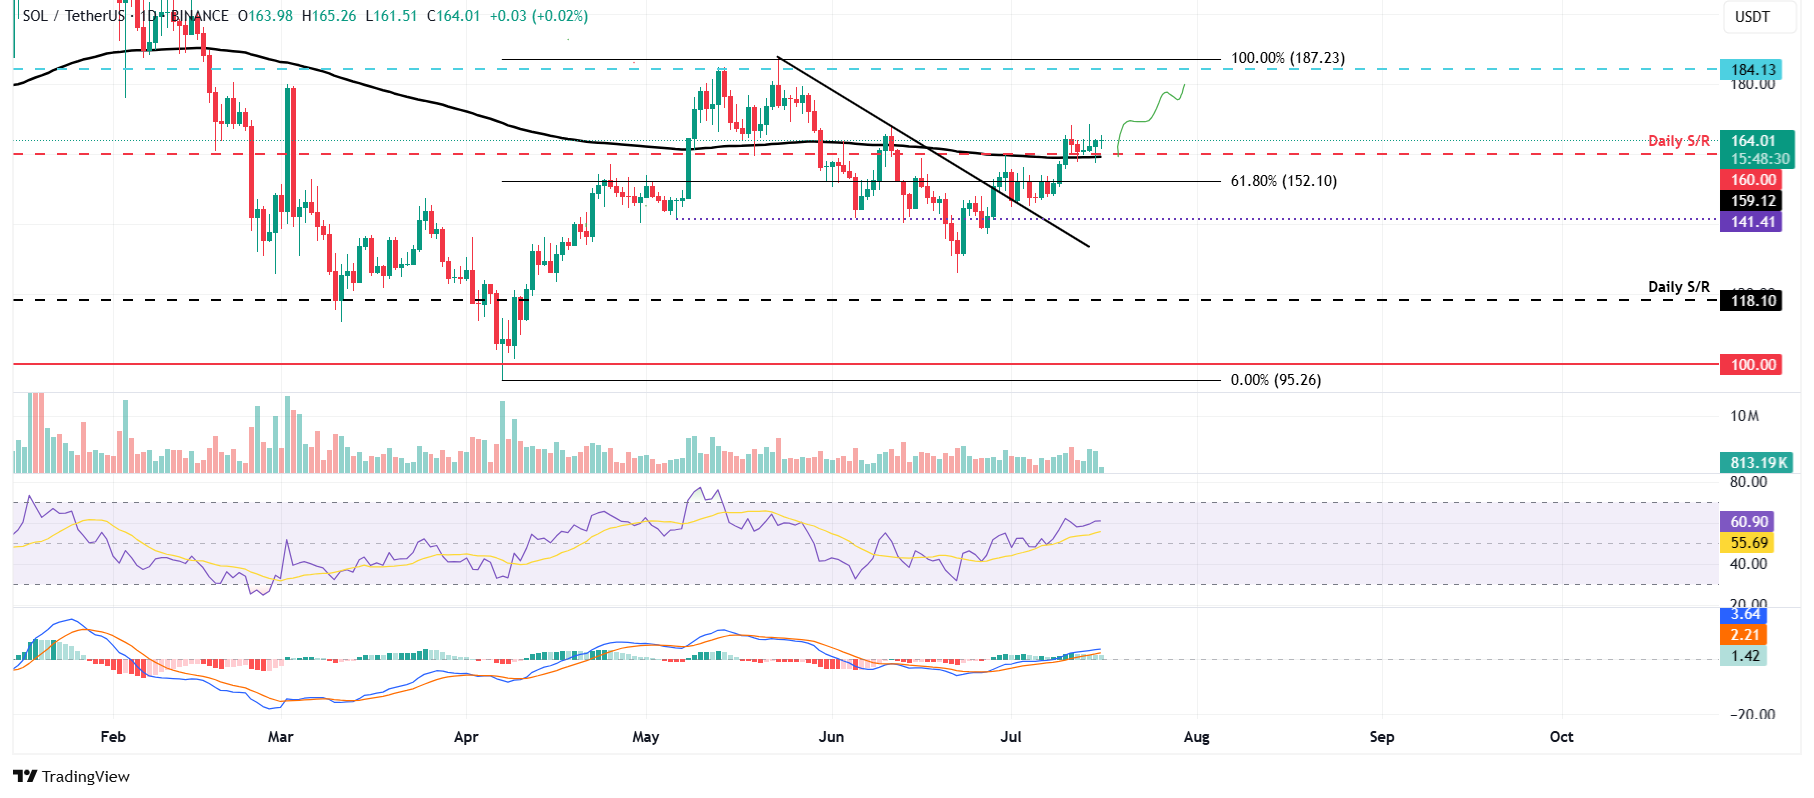
SOL/USDT daily chart
Conversely, if SOL faces a pullback, it could extend the decline to find support around the 61.8% Fibonacci retracement, drawn from the April 7 low of $95.26 to the May 23 high of $187.23, at $152.10 .
Author

Manish Chhetri
FXStreet
Manish Chhetri is a crypto specialist with over four years of experience in the cryptocurrency industry.


