Cardano Price Forecast: ADA bulls eye for a rally as Bitcoin hits new record highs
- Cardano price breaks out of a falling wedge pattern, hinting at a potential bullish reversal.
- ADA’s derivatives data show rising open interest and long positions, reflecting growing investor confidence.
- Technical analysis suggests a continuation of the rally, with bulls targeting the $0.73 resistance level.

Cardano (ADA) price stabilizes trading at around $0.62 at the time of writing on Thursday after breaking out of a falling wedge pattern the previous day. This bullish breakout comes as Bitcoin (BTC) reaches new all-time highs, fueling a wave of optimism for ADA and the overall cryptocurrency market. Derivatives data show that ADA’s open interest (OI) and bullish bets among traders are increasing, reflecting growing investor confidence. The technical outlook also suggests a continuation of the rally toward the $0.73 mark.
Cardano’s derivatives data show a bullish bias
CoinGlass derivatives data for Cardano shows a bullish picture. The open interest for ADA has increased by 13.66% over the last 24 hours, reaching $970.59 million. An increasing OI represents new or additional money entering the market and new buying, which could fuel the current ADA price rally.
The rising optimism in Cardano has triggered a wave of liquidations of nearly $4.10 million in the last 24 hours, with $3.8 million of these being short positions. With the wipeout of massive short positions, the long-to-short ratio for ADA reads 1.03 on Thursday. This ratio, above one, reflects bullish sentiment in the markets, as more traders are betting on the asset price to rally.
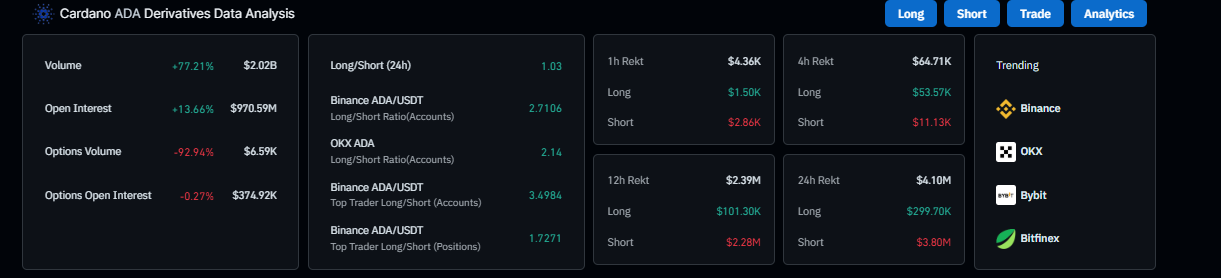
Cardano derivatives data chart. Source: Coinglass
Cardano Price Forecast: ADA breaks above a bullish reversal pattern
Cardano price broke above the upper resistance trendline of a falling wedge pattern on Wednesday. This pattern is formed by connecting multiple highs and lows with two trendlines from early May. At the time of writing on Thursday, it trades slightly down after retesting its 50-day Exponential Moving Average (EMA) at $0.62.
If ADA closes above its 50-day EMA at $0.62 on a daily basis, it could extend the rally toward its June 11 high of $0.73.
The Relative Strength Index (RSI) on the daily chart reads 54 and points upwards, indicating that bullish momentum is gaining traction. Additionally, the Moving Average Convergence Divergence (MACD) indicator showed a bullish crossover on June 29. It also shows rising green histogram bars above its neutral zero line, suggesting bullish momentum is gaining traction and continuing an upward trend.
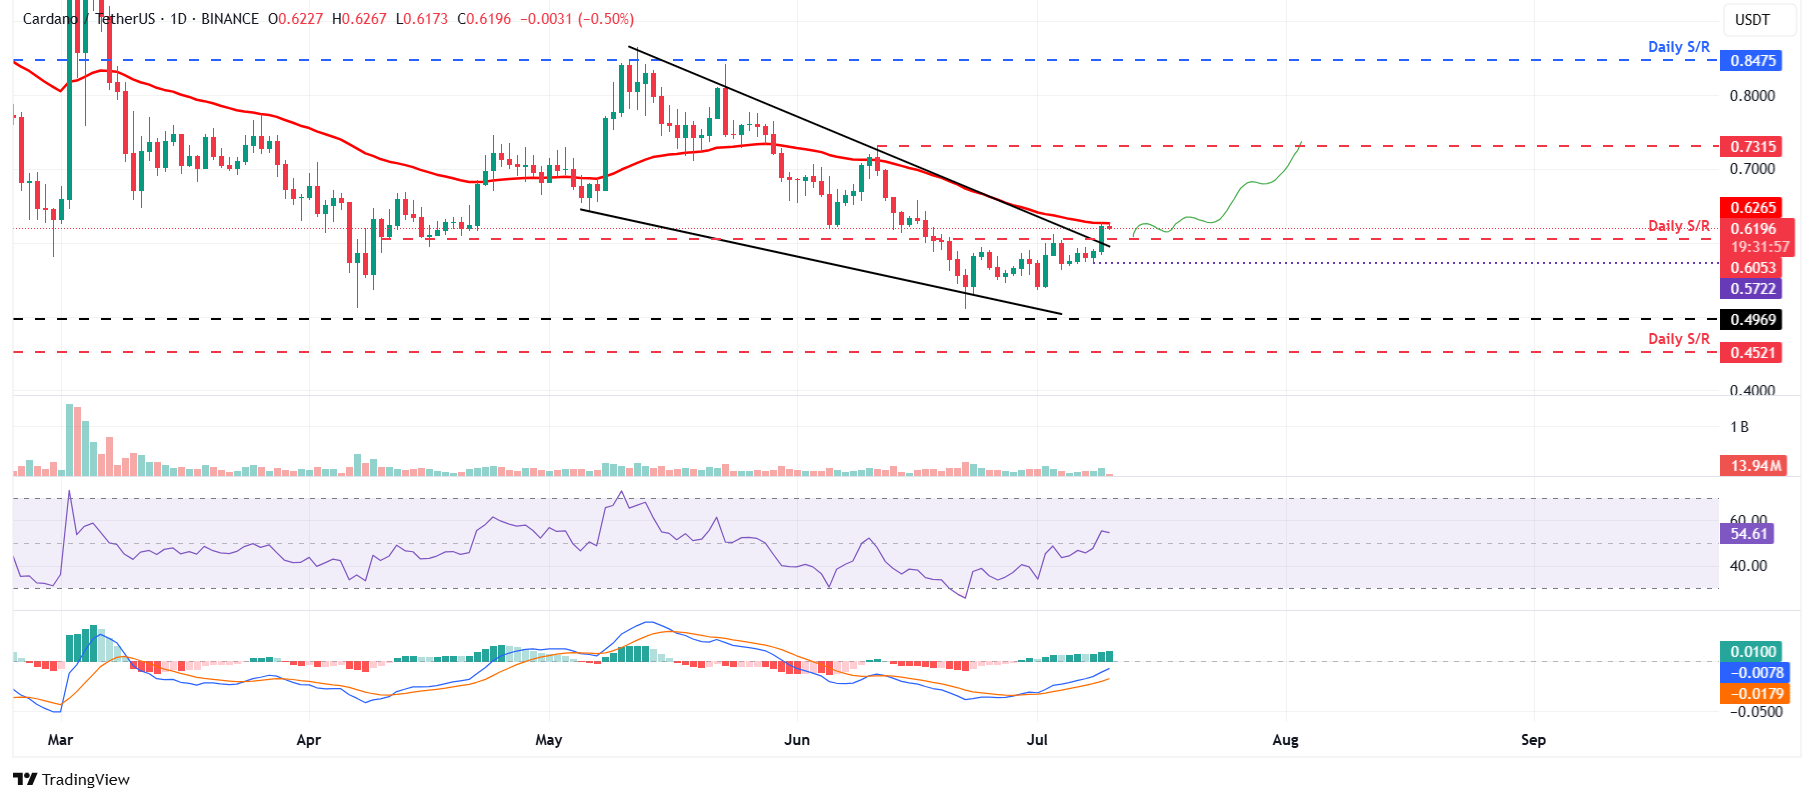
ADA/USDT daily chart
However, if ADA faces a correction and closes below $0.60, the daily support level, it could extend the decline toward Tuesday's low at $0.57.
Author

Manish Chhetri
FXStreet
Manish Chhetri is a crypto specialist with over four years of experience in the cryptocurrency industry.


