LUNA Price Prediction: Return to $20 likely
- LUNA price moves below key Ichimoku support levels.
- Bears could push LUNA price lower by -67.1%.
- Critical support zones below must hold for bulls to maintain an uptrend.

LUNA price action today has experienced the same dramatic and bearish moves as the broader market during the Tuesday trading session. The current LUNA price moves are certainly the most bearish to happen since the $11 breakout above the Ichimoku Cloud on July 28, 2021. The $18 to $20 value area is the last support zone before bears take over and push LUNA down to at least the $11 value area.
LUNA support under threat
LUNA has dropped below two key Ichimoku levels on the daily chart: the Tenkan-Sen ($29.49) and the Kijun-Sen ($26.68). Below those daily support levels are the weekly Tenkan-Sen ($21.38) and weekly Kijun-Sen ($20.46). Bull may find support against either the weekly Tenkan-Sen or Kijun-Sen if the Relative Strength Index (RSI) remains between the two oversold levels in a bull market: 40 and 50. The support at the $20 value area is further enhanced if the Composite Index moves at or below the low of July 20 (-13.60), creating hidden bullish divergence.
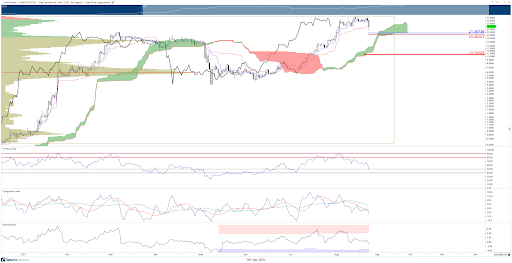
LUNA/USDT Daily Chart
Bulls should be cautious of any weakness below the $18 value area though. There is a high volume node present between $17 and $18. Below that high volume node is a massive volume trough in the volume profile. The 2021 VPOC (Volume Point-Of-Control) is at $6 and has not been tested since LUNA broke above that prior congestion zone.
Any move below $18 could generate another flash crash to the next support zone in the Ichimoku system, which does not occur until the $10-$11 value area. The daily Senkou Span A and Senkou Span B, as well as the weekly Senkou Span B, all exist within the $10 - $11 range, creating a solid support zone and a likely area for bears to target. This is also a value area where prominent institutional participants may fill their order books and accumulate.
Author

FXStreet Team
FXStreet
Composed of a group of economic journalists and FX experts, the FXStreet content team produces and oversees all content published on FXStreet. It provides a purely journalistic approach to the Forex market.




