Litecoin Technical Analysis: LTC poised to flip bullish if support at $70 holds
- Litecoin technical levels are improving as buyers work to secure support above $70.
- A sell signal may manifest on the daily chart in the coming sessions, validating the bullish outlook.

Litecoin seems to be hunting for support above $70, following another rejection at $75. This expected support's role is to shift the bulls' focus to higher price levels, preferably above $80. Moreover, the buyer congestion zone might help avert any potential declines back to the robust support at $65.
Litecoin bulls eagerly search for support ahead of a rebound
LTC/USD is exchanging hands at $71.2. It is an uphill battle for the bulls and the bears. The winner of the tug of war will shape the direction Litecoin takes. A rebound may come into play for the bulls, allowing them to push the price past the short-term hurdle at $75 and the 200 Simple Moving Average.
Price action beyond $80 will call for massive buy orders mainly because it will confirm the return of the bulls as well as LTC's ability to recover following a correction in a bull market.
Similarly, the Relative Strength Index shows that Litecoin is oversold at the moment. Therefore, a rebound is most likely in the near term. A descending wedge pattern hints at a potentially massive breakout, perhaps above $80.
%20(16)-637432667931696927.png)
LTC/USD 4-hour chart
The TD Sequential indicator could present a buy signal in the form of a red nine candlestick on the daily chart. The bullish outlook will see the demand for LTC surge, thereby creating enough volume to support a significant upward price action.
On the same daily chart, Litecoin is trading above the parabolic SAR points, adding credibility to the bullish narrative.
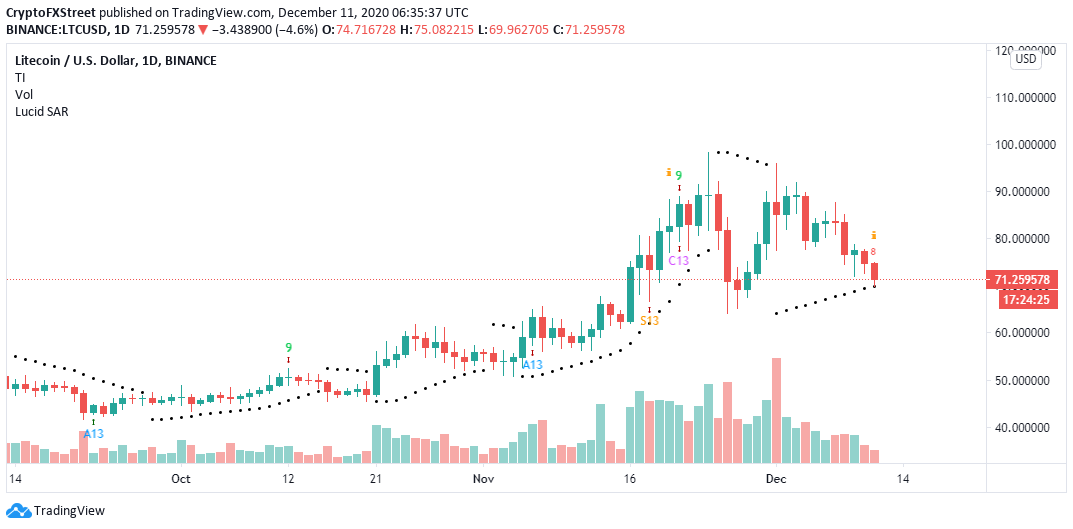
LTC/USD daily chart
The bullish outlook will be invalidated if Litecoin fails to secure support above $70. The bearish leg might stretch to $65, where a double-bottom pattern may perhaps form. Here, buyers will plan for a well-executed recovery mission towards $100.
Author

John Isige
FXStreet
John Isige is a seasoned cryptocurrency journalist and markets analyst committed to delivering high-quality, actionable insights tailored to traders, investors, and crypto enthusiasts. He enjoys deep dives into emerging Web3 tren


