|

Litecoin price is stuck between two massive walls while on-chain metrics lean bearish

  • Litecoin price is currently bounded inside an ascending triangle pattern on the 4-hour chart.
  • It seems that LTC whales have been selling significant quantities of the coin, indicating strong selling pressure.

Litecoin is currently trading at $83.71 inside an ascending triangle pattern on the 4-hour chart. Several on-chain metrics show that large LTC investors are selling, which adds selling pressure to the market and shifts the odds in favor of the bears. 

Litecoin faces strong selling pressure and a potential dive towards $60

It seems that Litecoin whales have been selling a lot of coins in the past week as the number of holders with 100,000 - 1,000,000 coins has dropped from 121 on November 18 to 114 currently. Furthermore, there are two fewer whales holding between 1,000,000 and 10,000,000 ($83,000,000 and $830,000,000), which is significant. 

ltc price

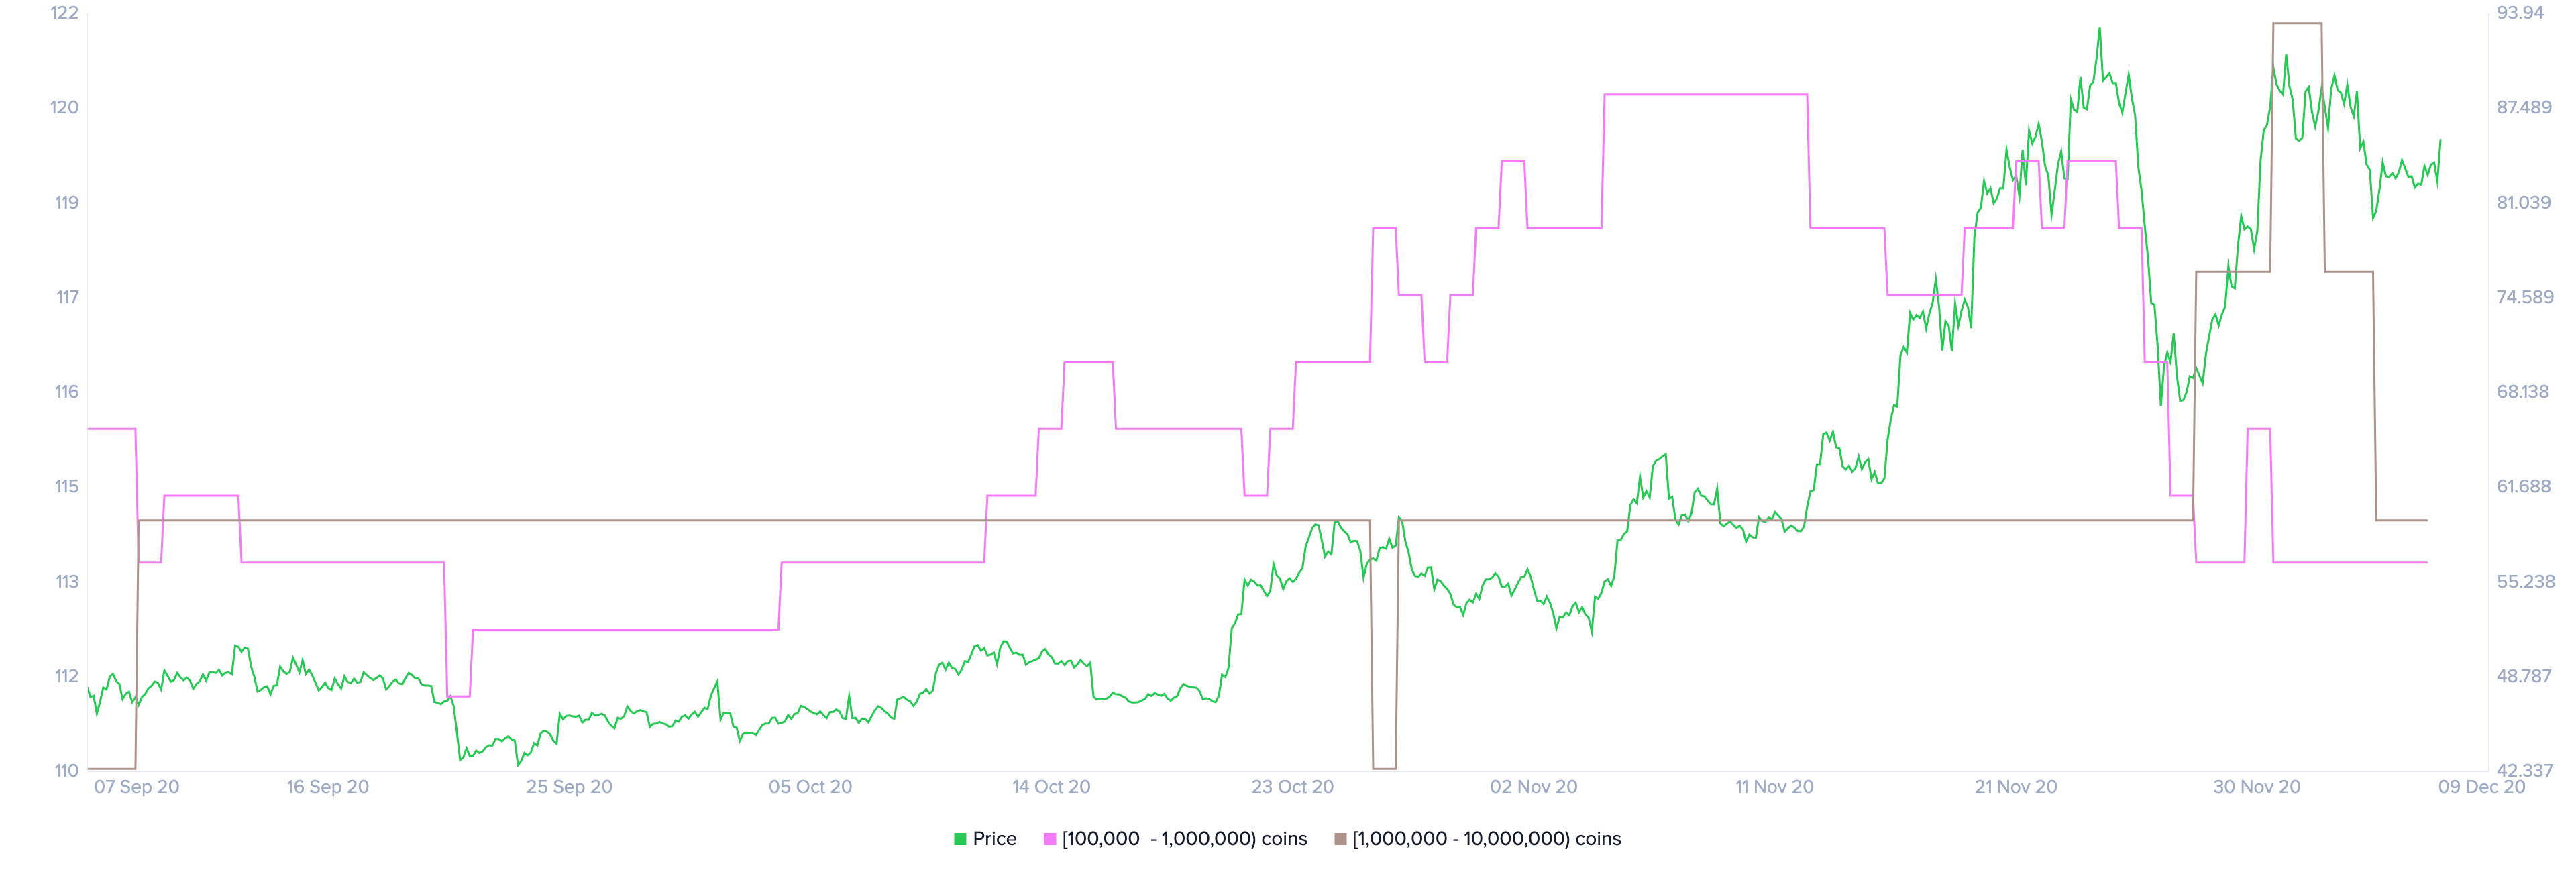
LTC Holders Distribution chart

On the 4-hour chart, Litecoin price has developed an ascending triangle pattern. A breakdown below the lower boundary of the pattern would drive LTC towards a low of $60.

ltc price

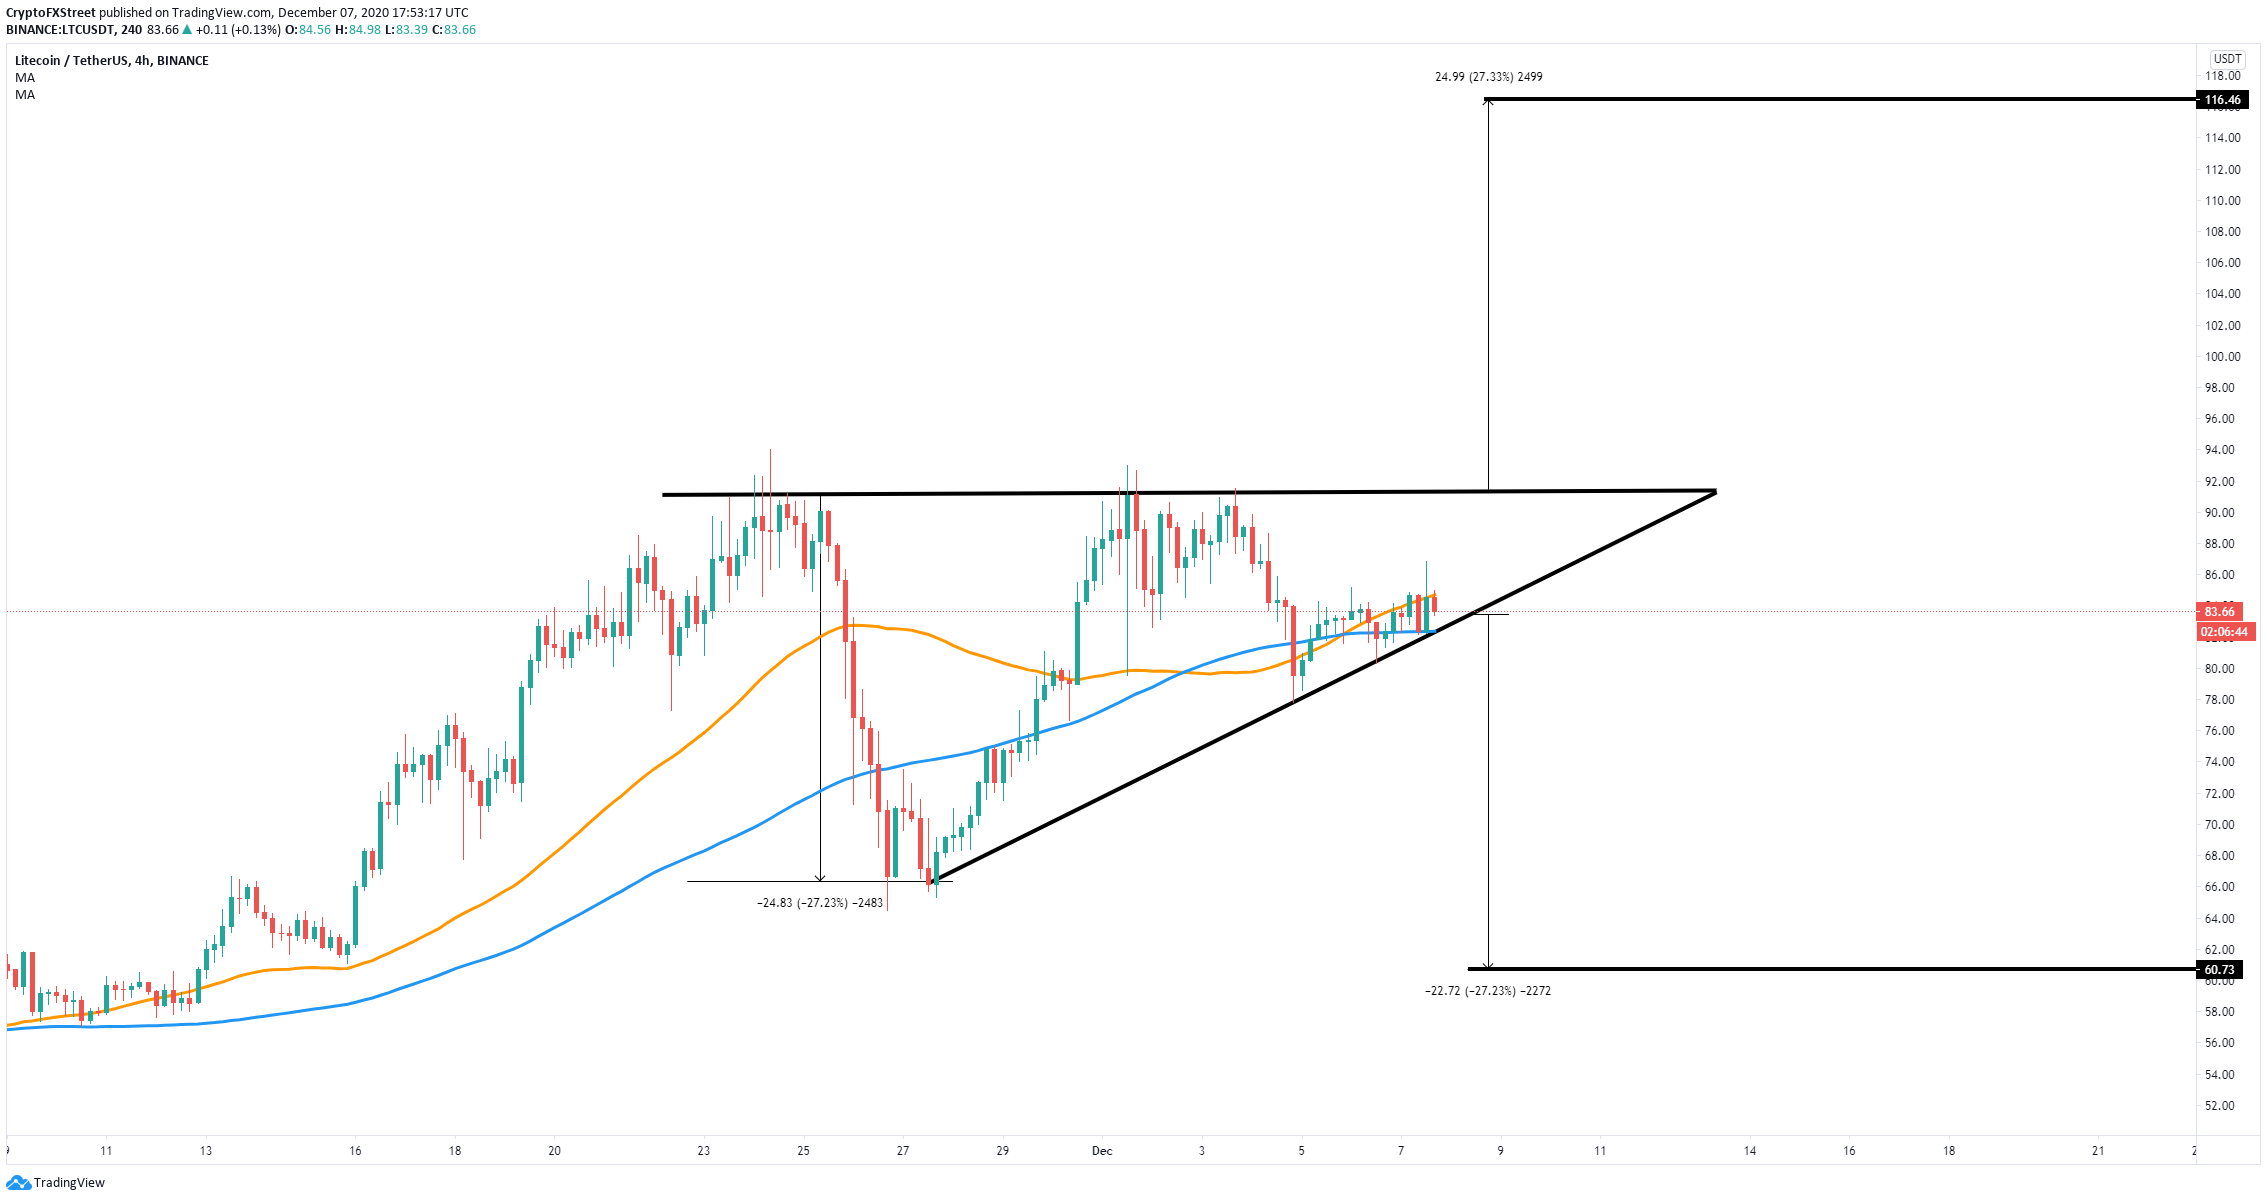
LTC/USD 4-hour chart

On the other hand, if bulls can recover the 50-SMA support level on the 4-hour chart, Litecoin price could climb towards the upper trendline of the pattern. A breakout above this point would lead the digital asset to a high of $116.
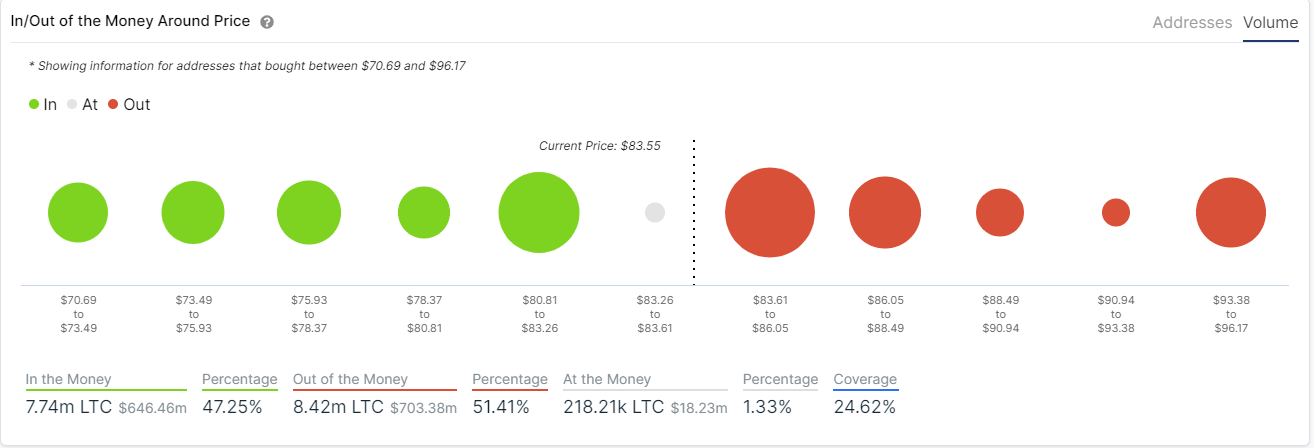
ltc price

LTC IOMAP chart

At the same time, the In/Out of the Money Around Price (IOMAP) chart shows a lot of resistance ahead between $83 and $88.5 and one significant support area between $83.26 and $80.81. 

Author

Lorenzo Stroe

Lorenzo Stroe

Independent Analyst

Lorenzo is an experienced Technical Analyst and Content Writer who has been working in the cryptocurrency industry since 2012. He also has a passion for trading.

More from Lorenzo Stroe
Share:

Editor's Picks

Top 3 Price Prediction: Bitcoin, Ethereum, Ripple deepen sell-off as bears take control of momentum

Bitcoin, Ethereum, and Ripple continued their corrections on Friday, posting weekly losses of nearly 6%, 3%, and 5%, respectively. BTC is nearing the November lows at $80,000, while ETH slips below $2,800 amid increasing downside pressure.

Shiba Inu Price Forecast: SHIB extends losses as whale selling intensifies bearish momentum

Shiba Inu (SHIB) price slips below $0.0000077 on Thursday after correcting the previous day. Bearish sentiment is further strengthened as holders offload SHIB, increasing selling pressure and reducing Open Interest in the derivatives market.

Top Crypto Losers: Worldcoin, Chiliz, Hyperliquid lead losses as market bleeds $1.75 billion

Worldcoin , Chiliz , and Hyperliquid posted heavy losses over the last 24 hours as Bitcoin dropped below $82,000 on Friday, triggering a $1.75 billion wipeout and mirroring the bearish tremors in the US stock market.

Fidelity unveils FIDD stablecoin, set to launch in coming weeks

Fidelity Investments announced that it will launch its first stablecoin, the Fidelity Digital Dollar (FIDD), making it one of the first large traditional firms in the US to do so.

Bitcoin Price Annual Forecast: BTC holds long-term bullish structure heading into 2026

Bitcoin (BTC) is wrapping up 2025 as one of its most eventful years, defined by unprecedented institutional participation, major regulatory developments, and extreme price volatility.

Bitcoin: BTC correction deepens as Fed stance, US-Iran risks, mining disruptions weigh

Bitcoin (BTC) price extends correction, trading below $82,000 after sliding more than 5% so far this week. The bearish price action in BTC was fueled by fading institutional demand, as evidenced by spot Exchange-Traded Funds (ETFs), which recorded $978 million in inflows through Thursday.