Litecoin Price Prediction: LTC is only one bump away from hitting $100 – Confluence Detector
- Litecoin majestically rises above $80 but hits a barrier at $85.
- On-chain metrics reinforce the immense support under LTC.
- A reversal above the confluence resistance and $85 may catapult LTC toward $100.

Litecoin recently soared to highs above $80 following a predicted breakout. The support at $70 held its ground, giving bulls ample time to plan a breakout above the descending wedge pattern. LTC/USD stepped above several critical levels, including the 200 Simple Moving Average, the 100 SMA, and 50 SMA.
Litecoin takes a hiatus above $80 amid the journey to $100
The bullish leg almost touched $85 but stalled. Litecoin has retreated towards $80 and seeking support at the 100 SMA. Settling above $80 is key to securing the bullish narrative to $100. Meanwhile, the cryptoasset is trading at $81.2 amid the bulls' push to resume the uptrend.
The impact of the wedge pattern breakout was significant to the price action towards $85. However, stepping above this hurdle would pave the way for gains to $100. It is essential to realize that expected seller congestion at $90 and $95 may delay recovery.
-637435191685821887.png)
LTC/USD 4-hour chart
According to the confluence detector, Litecoin faces one critical hurdle at $82.3 before making the final approached to $100. The seller congestion has been highlighted by the Fibonacci 23.6% one-day. On the downside, support seems to have been established at $81.9, as shown by the one-hour previous low.
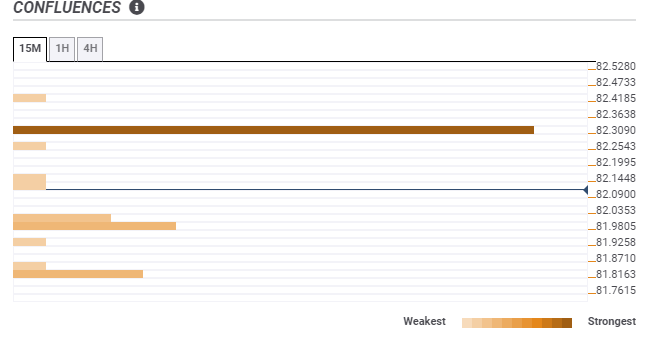
LTC/USD confluence levels
IntoTheBlock's IOMPA model reveals that Litecoin has a relatively smooth path towards $100. However, the selling pressure between $81.2 and $83.6 must be pushed in the rearview first. Here, nearly 57,000 addresses had recently purchased roughly 1.9 million LTC.
On the flip side, support for LTC has been reinforced by the IOMAP. Massive successive anchor zones keep the cryptoasset in position. The most robust buyer congestion runs from $75.9 to $78.4. Here, roughly 54,900 addresses previously purchased approximately 3 million LTC.
-637435192353839229.png)
Litecoin IOMAP chart
On the other hand, it worth mentioning that headwind might intensify if Litecoin fails to break above the confluence hurdle. Moreover, closing the day under the 100 SMA could trigger more sell orders, perhaps create enough volume to revisit the support at $70.
Author

John Isige
FXStreet
John Isige is a seasoned cryptocurrency journalist and markets analyst committed to delivering high-quality, actionable insights tailored to traders, investors, and crypto enthusiasts. He enjoys deep dives into emerging Web3 tren



