Litecoin Price Prediction: LTC faces one significant resistance before ultimate push to $200
- Litecoin price is trading inside a descending triangle pattern on the 12-hour chart.
- Climbing above $160 decisively can quickly drive LTC towards $200.
- LTC faces really weak resistance on the way up as bulls hold the momentum.

Litecoin price had a significant 7% surge in the past several hours thanks to Bitcoin’s new all-time high at $45,000 after Tesla announced the purchase of $1.5 billion worth of Bitcoin and potentially other digital assets in the future.
Litecoin price can jump to $200 if this level drops
On the 12-hour chart, Litecoin has established a descending triangle pattern with a resistance level located at $160. Breaking above this point will drive Litecoin price above $200 to a price target of around $208.
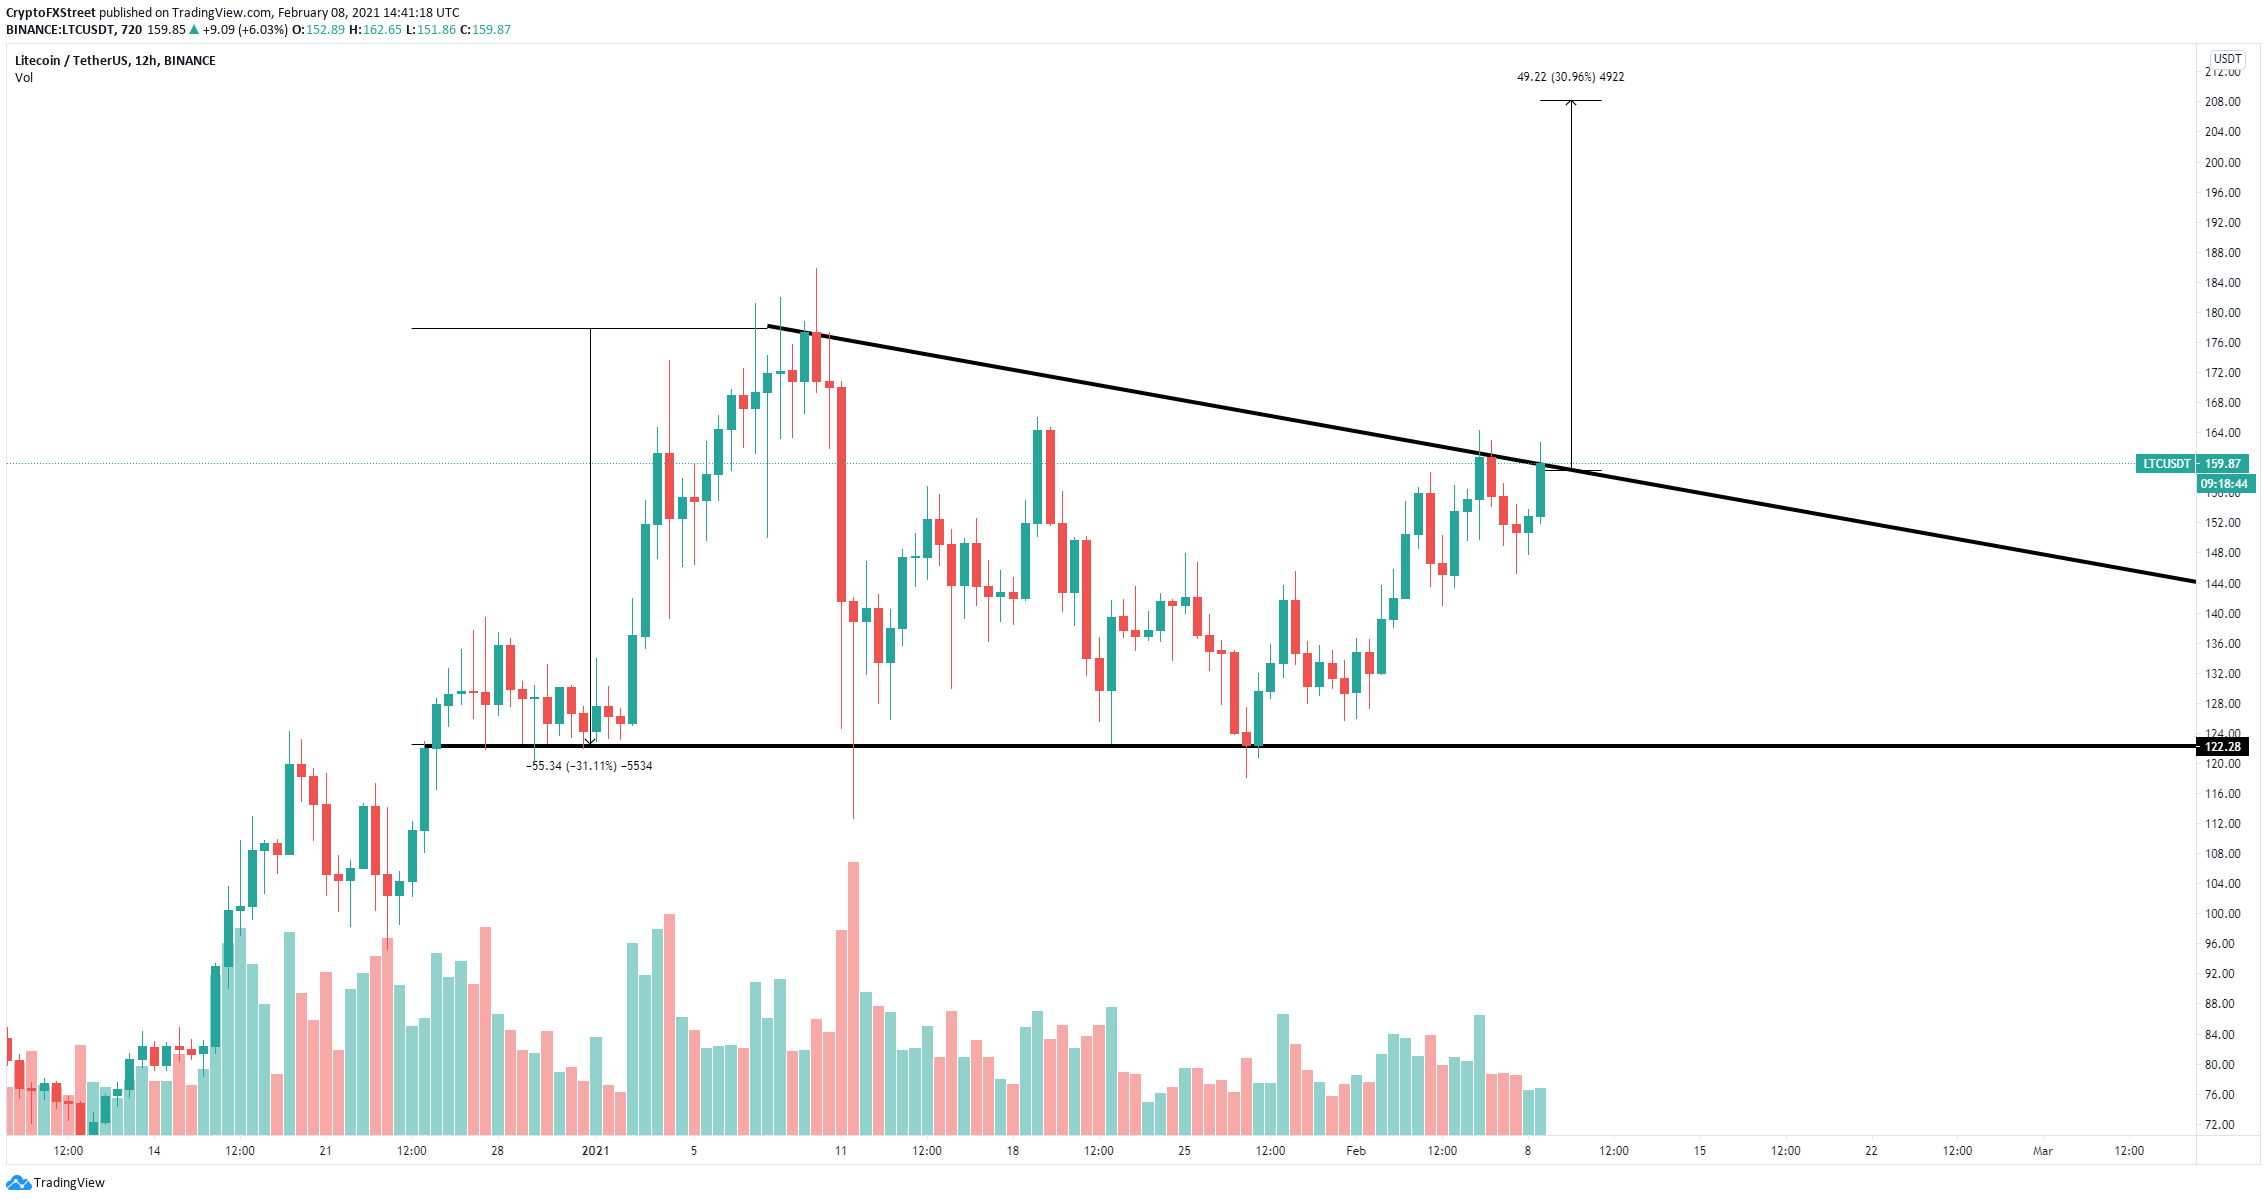
LTC/USD 12-hour chart
The In/Out of the Money Around Price (IOMAP) chart shows that bulls have far better odds than bears as the resistance above is extremely weak while there is a lot of support on the way down.
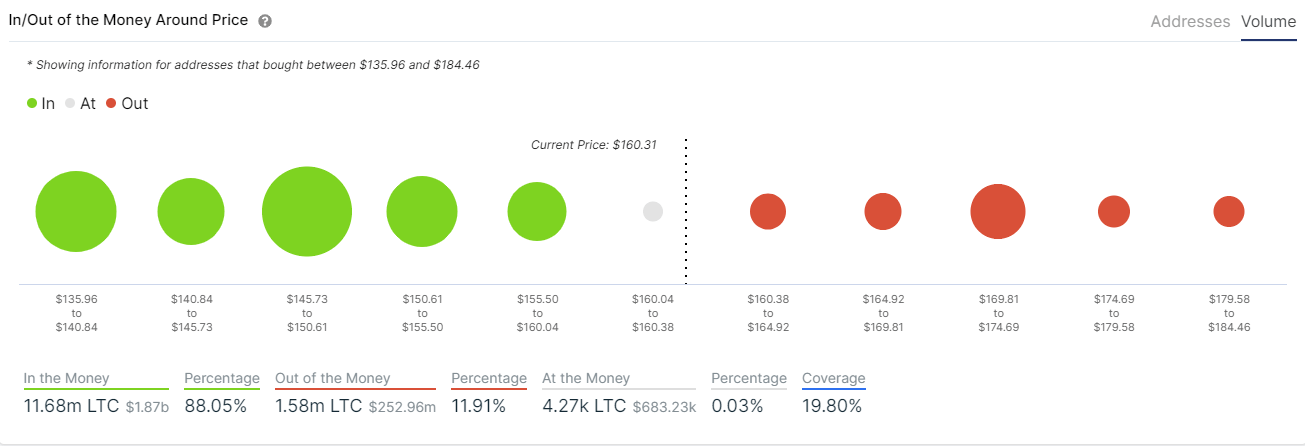
LTC IOMAP chart
The IOMAP model indicates that the strongest resistance area is located between $170 and $174 which means that LTC should spike to $200 if this range is broken.
%20[15.58.44,%2008%20Feb,%202021]-637483931306044982.png)
LTC Holders Distribution chart
Unfortunately, it seems that the number of whales holding between 100,000 and 1,000,000 LTC ($16,000,000 and $160,000,000) has significantly declined in the past week from a peak of 116 on January 31 to 111 currently which indicates large holders have been selling and taking profits.
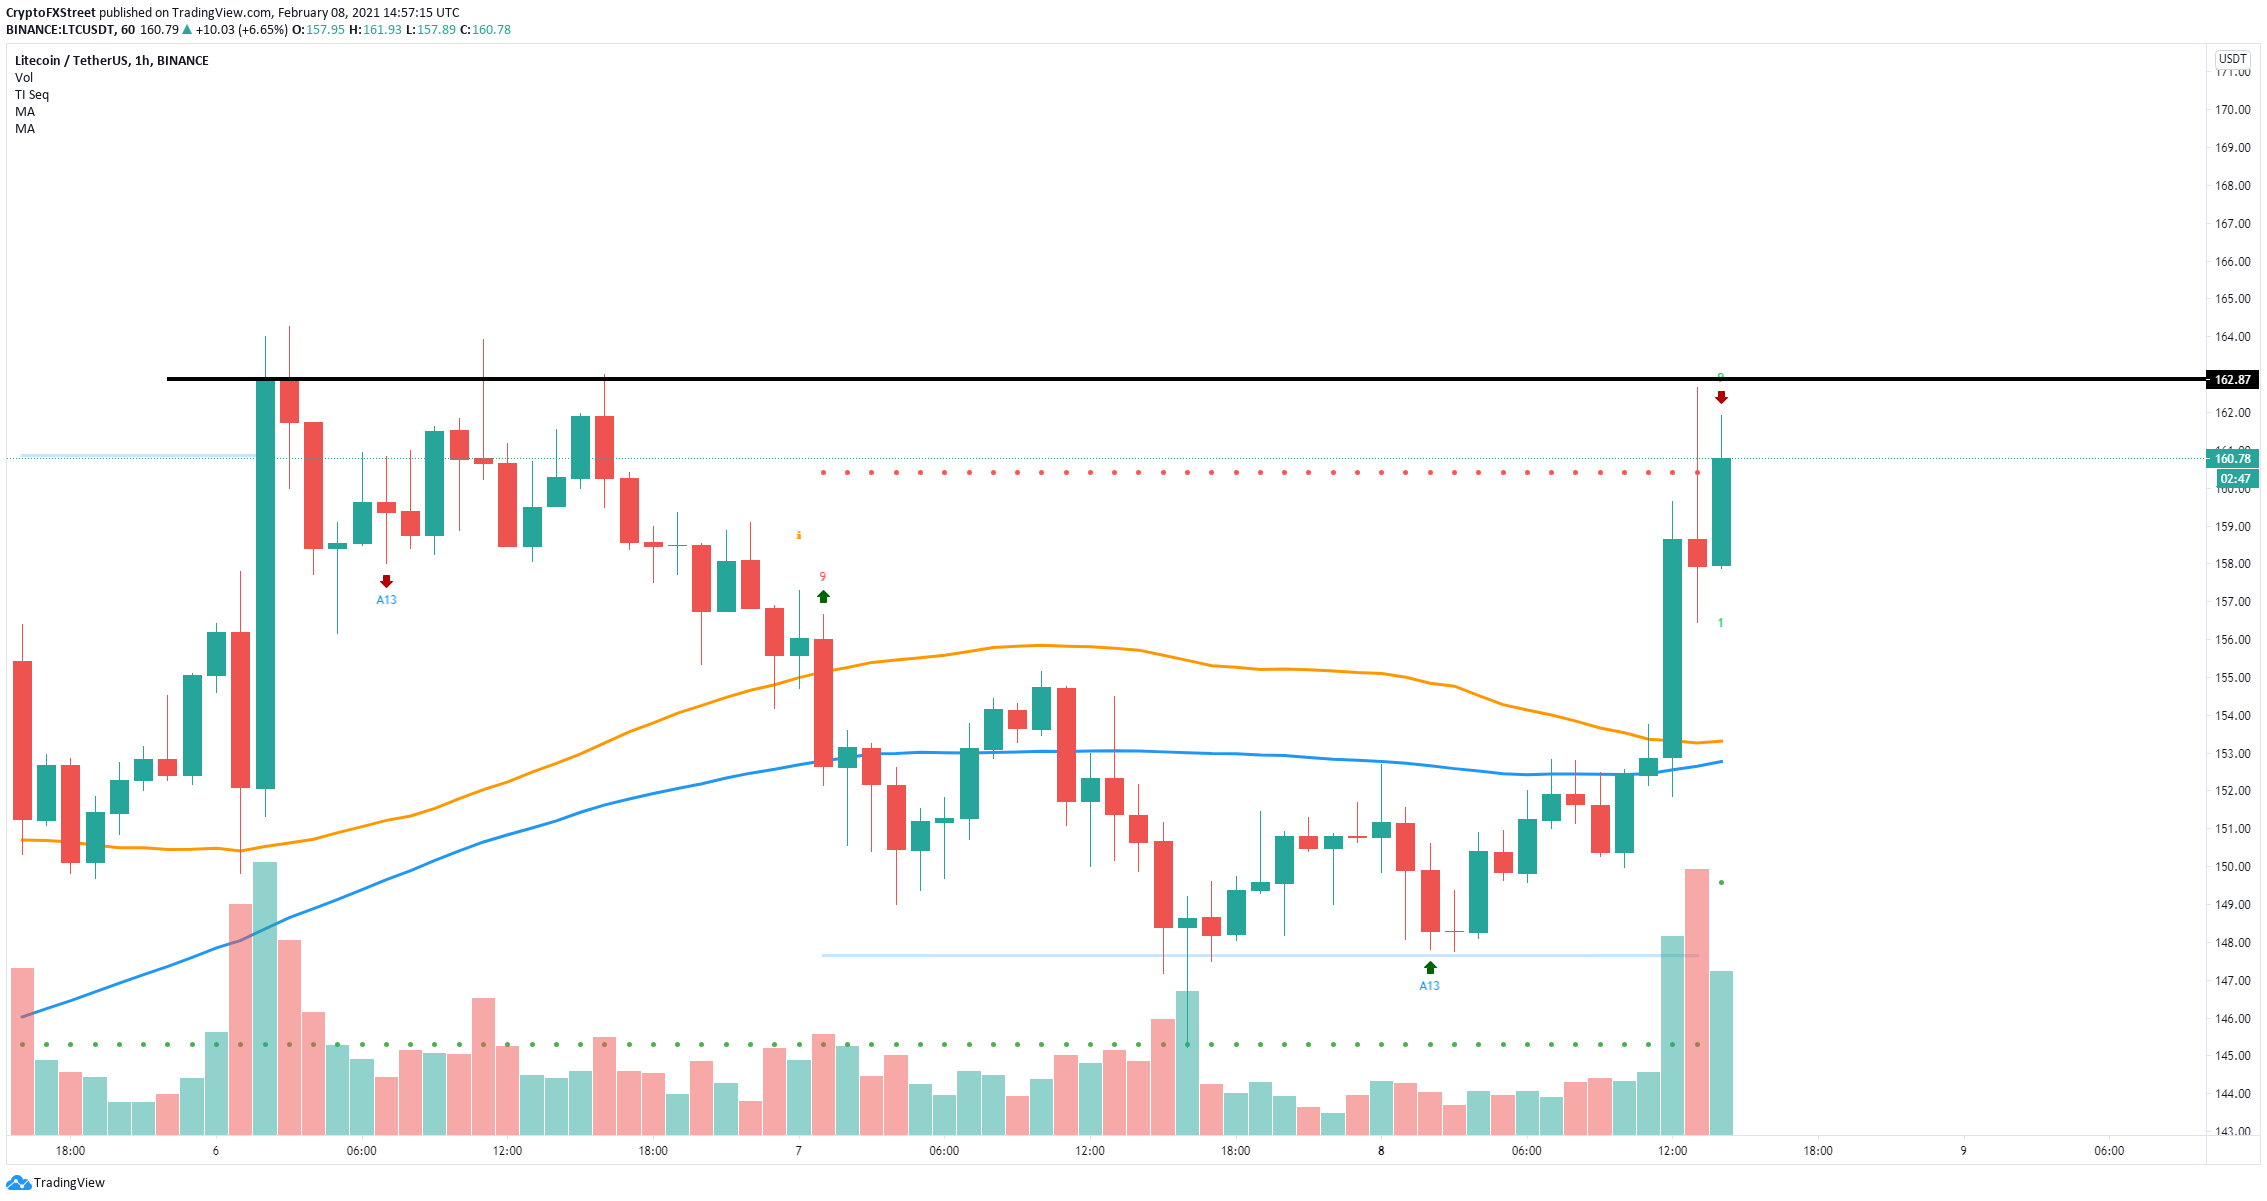
LTC/USD 1-hour chart
On the 1-hour chart, the TD Sequential indicator has presented a sell signal right at the top of another significant resistance level at $163. Validation of this call could push Litecoin price down towards $153 where both the 50-SMA and the 100-SMA converge.
Author

Lorenzo Stroe
Independent Analyst
Lorenzo is an experienced Technical Analyst and Content Writer who has been working in the cryptocurrency industry since 2012. He also has a passion for trading.



