Litecoin Price Forecast: LTC enters new bull rally towards $300
- Litecoin price flashes bullish signs on lower and higher time frames hinting at a massive rally.
- LTC bulls could push prices to retest previous all-time highs.
- On-chain metrics suggest a strong foundation for the upcoming rally.

Litecoin price has seen a continuation of the stellar performance it had in 2020. At the time of writing, the token has witnessed a 100% year-to-date bull run. Due to the recent breakout from a consolidation pattern, LTC looks promising for another leg up.
Litecoin price is on track to $300
On February 2, Litecoin price put an end to the descending triangle consolidation. Since then, LTC’s market value has risen by more than 10%.
The target projected by this consolidation pattern surpasses 35%, which is the measure of the distance of the triangle's y-axis. Hence, Litecoin price continues to trend higher, then $187 could be the bulls' target.
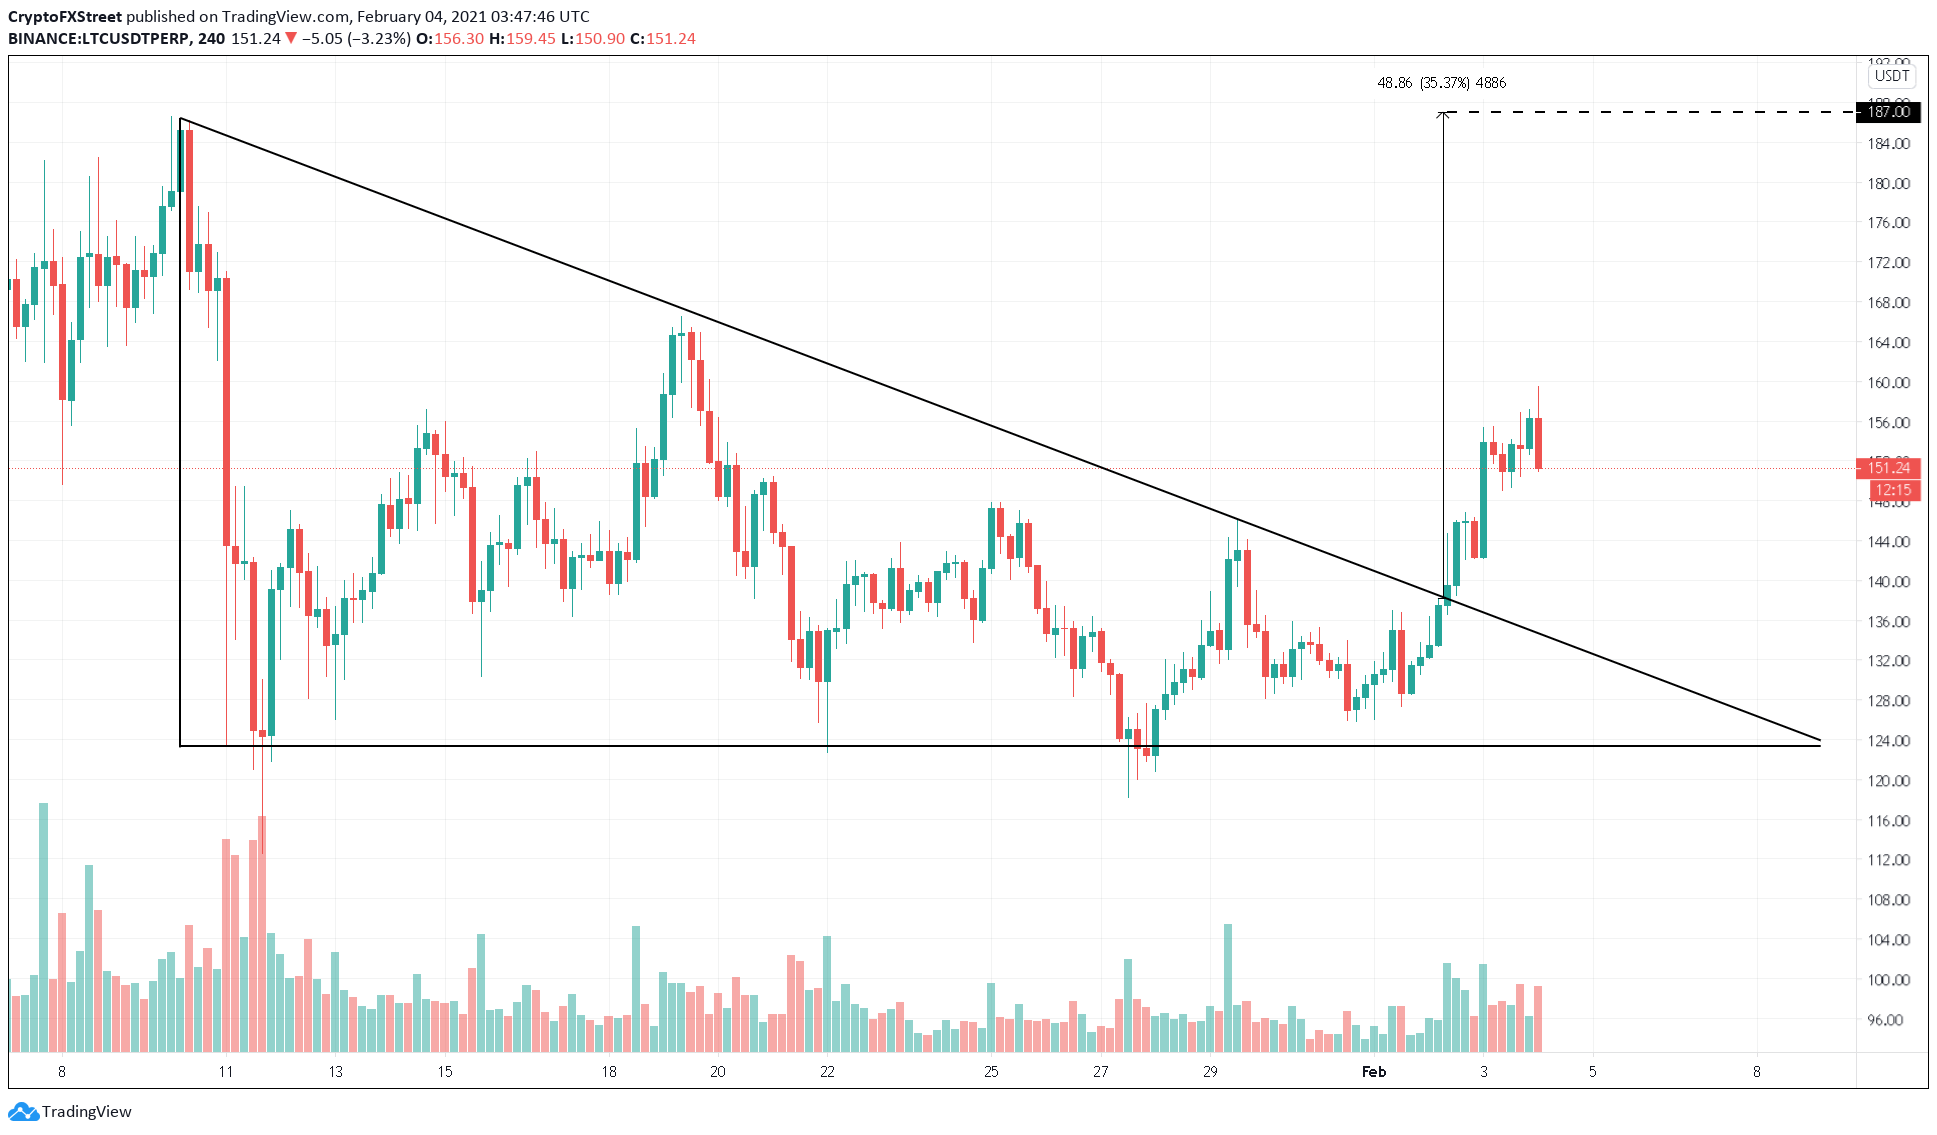
LTC/USDT 4-hour chart
The 1-week chart shows an extremely bullish scenario for Litecoin as that may see it retest its ATH at $385. The bullish thesis originates from a W-shaped recovery for LTC, which is quite similar to what Ethereum has witnessed.
LTC price is in the last leg of this fractal and may rise by nearly 150% over the span of 150 days.
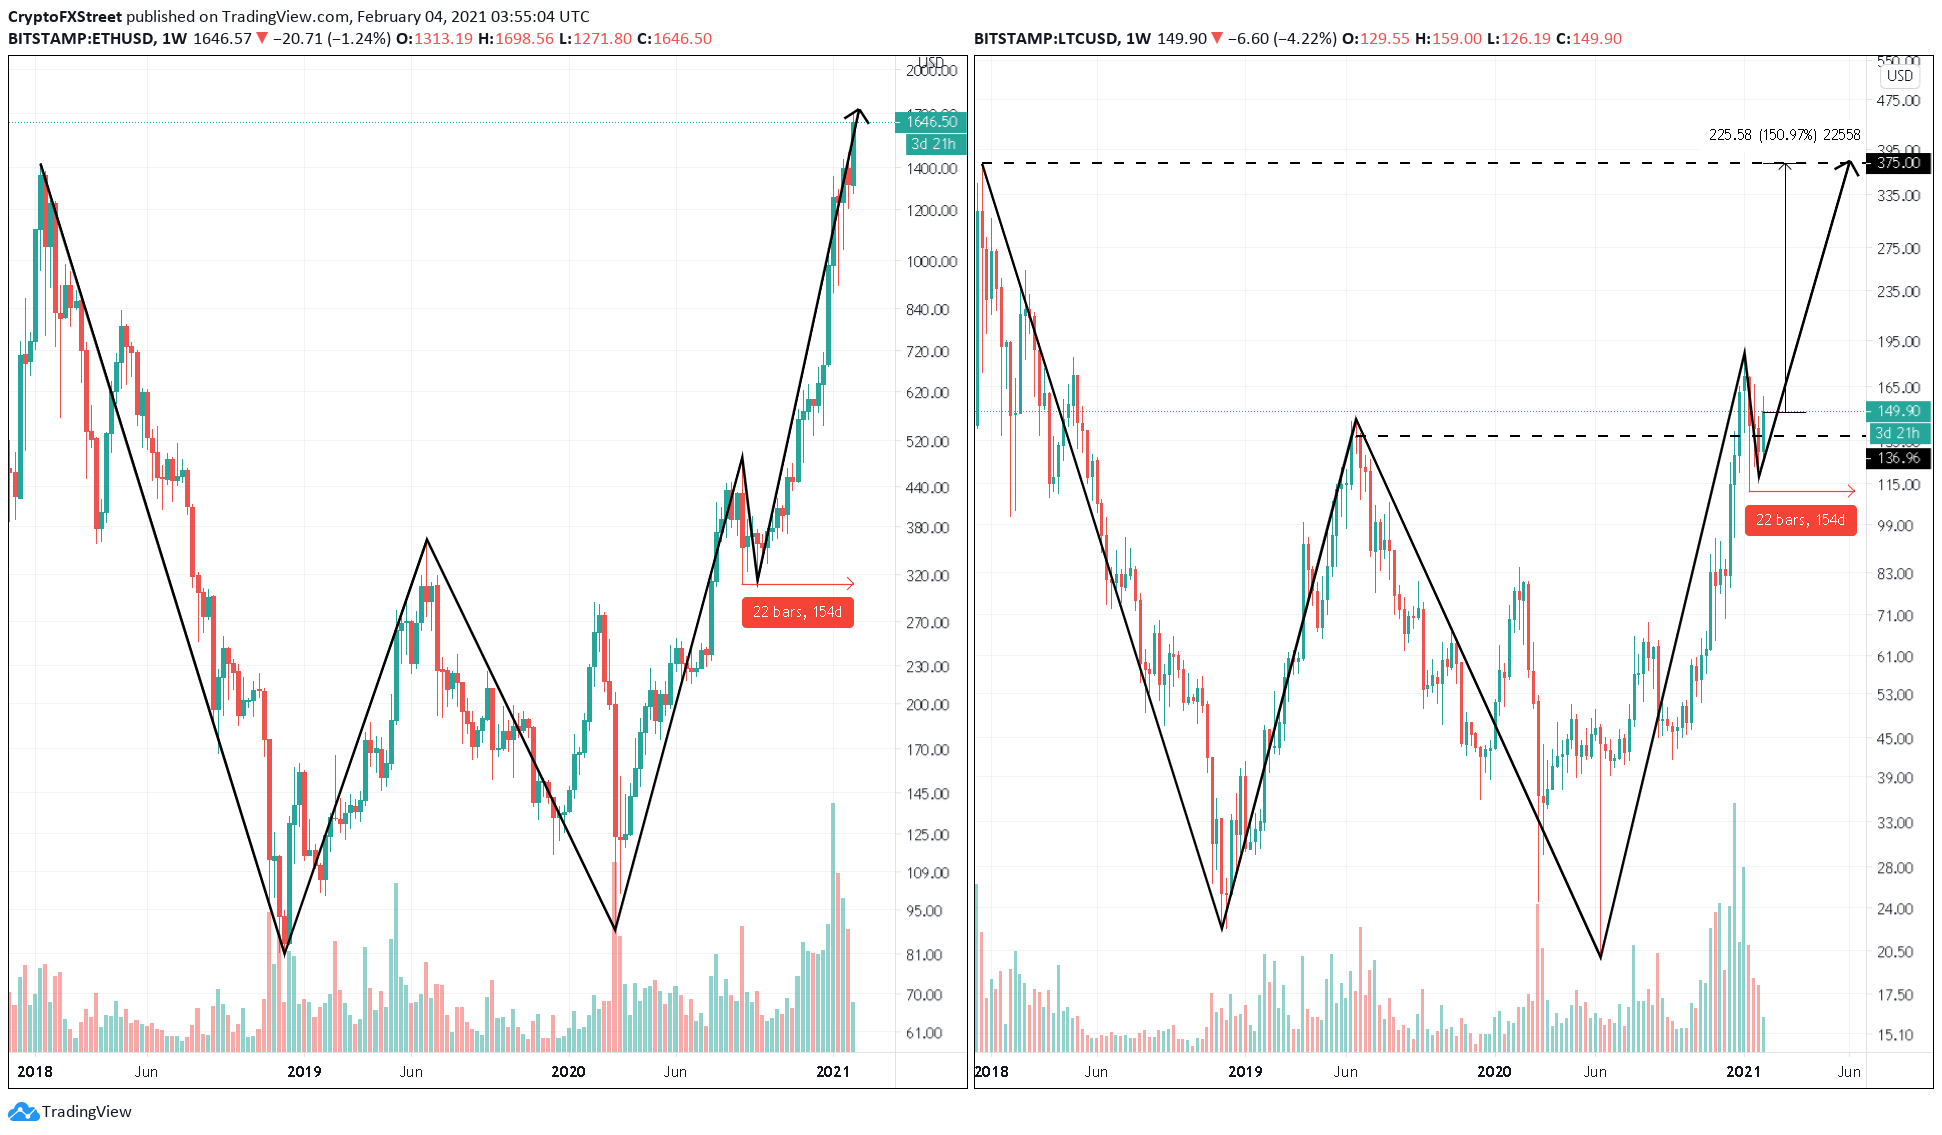
LTC/USDT 1-week chart
Sitting on top of stable support
Adding credence to both the optimistic view is Litecoin's holders distribution chart.
This on-chain metric shows that whales are back in accumulation mode. The number of addresses holding 100,000 to 1,000,000 LTC has seen a 1.60% increase since mid-January, fueling the upward pressure seen recently.
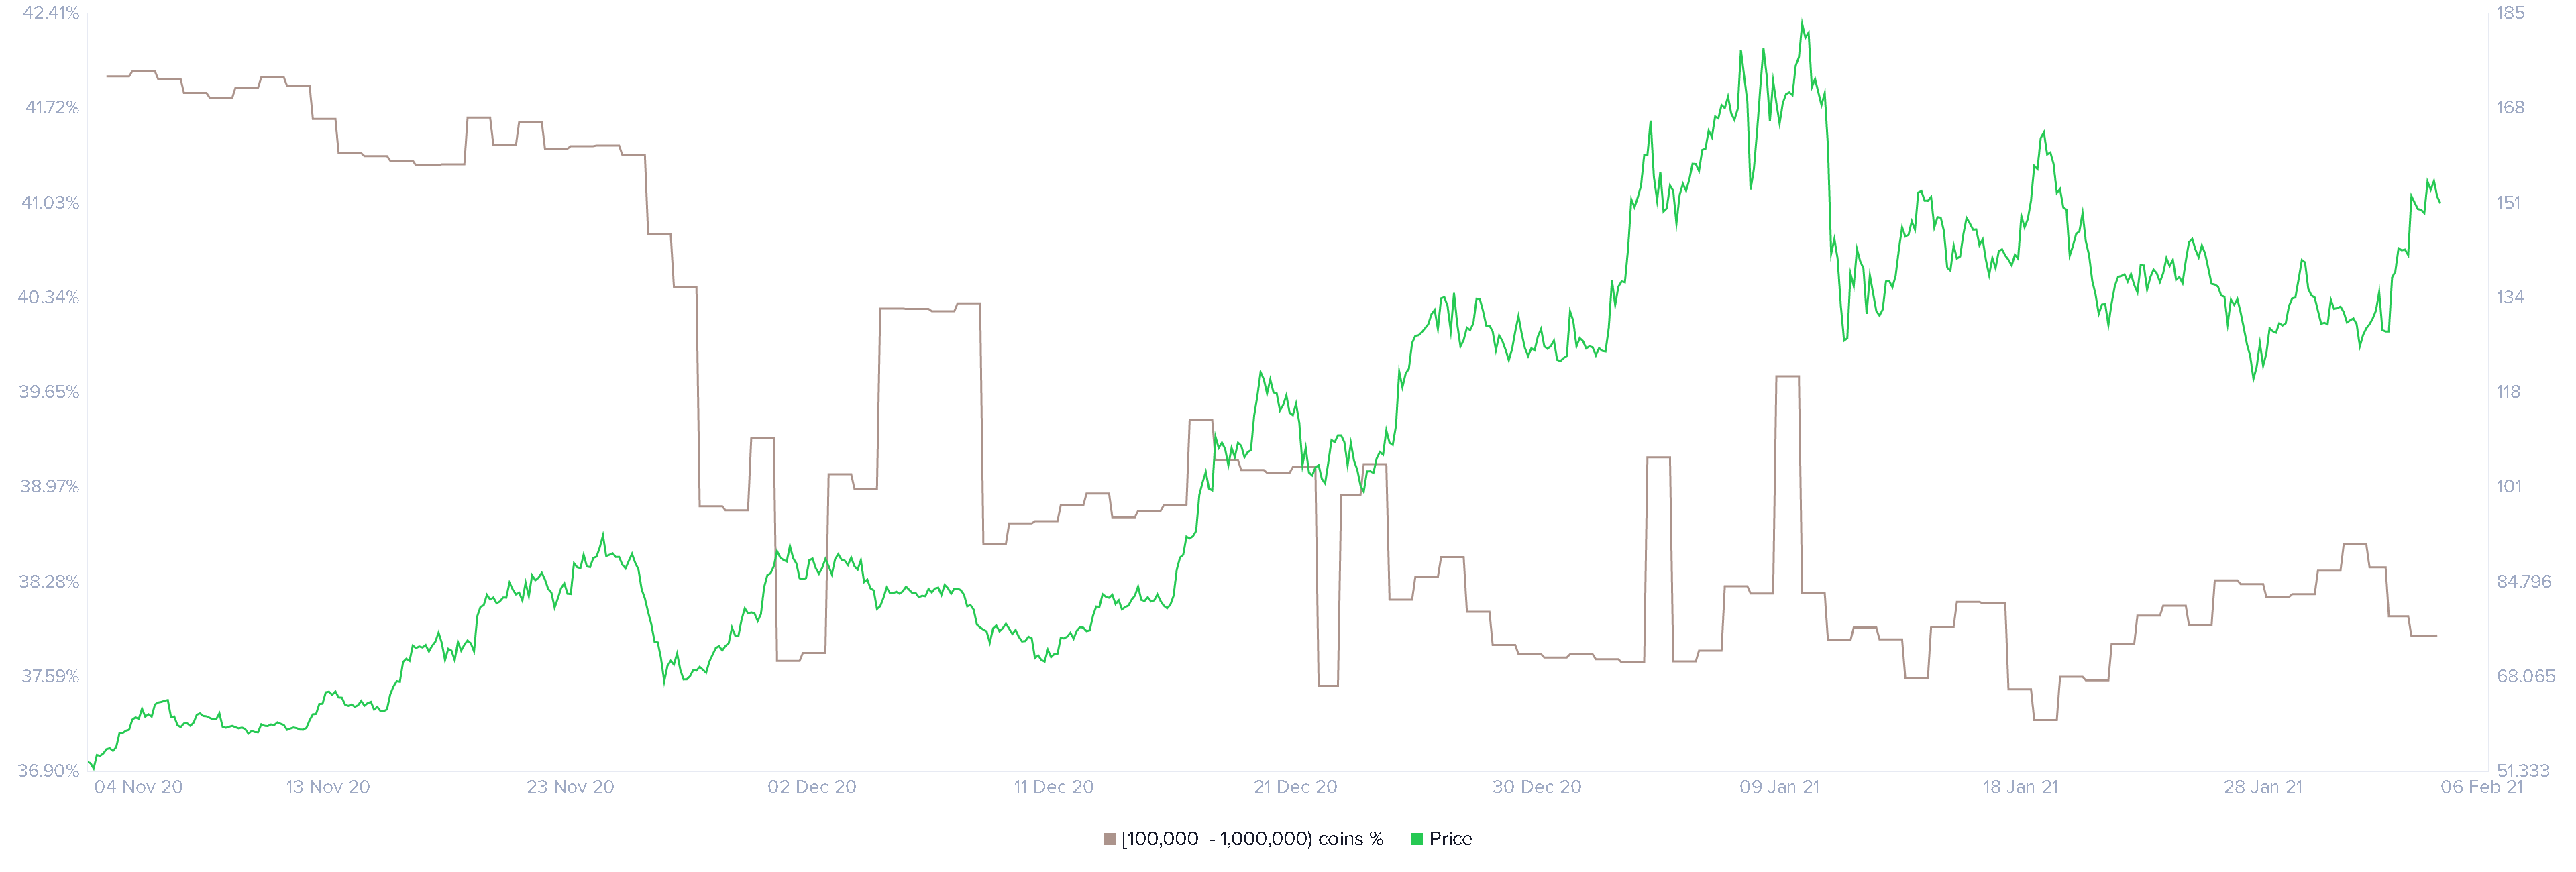
Litecoin Holder Distribution Combined Balance chart
IntoTheBlock's In/Out of the Money Around Price (IOMAP) shows that 130,000 addresses purchased almost 5 million LTC around the $135 price level. Thus, any short-term selling pressure around could be absorbed by holders who do not want to see their investment go underwater.
As long as the $135 support level holds, Litecoin's bullish thesis remains intact.
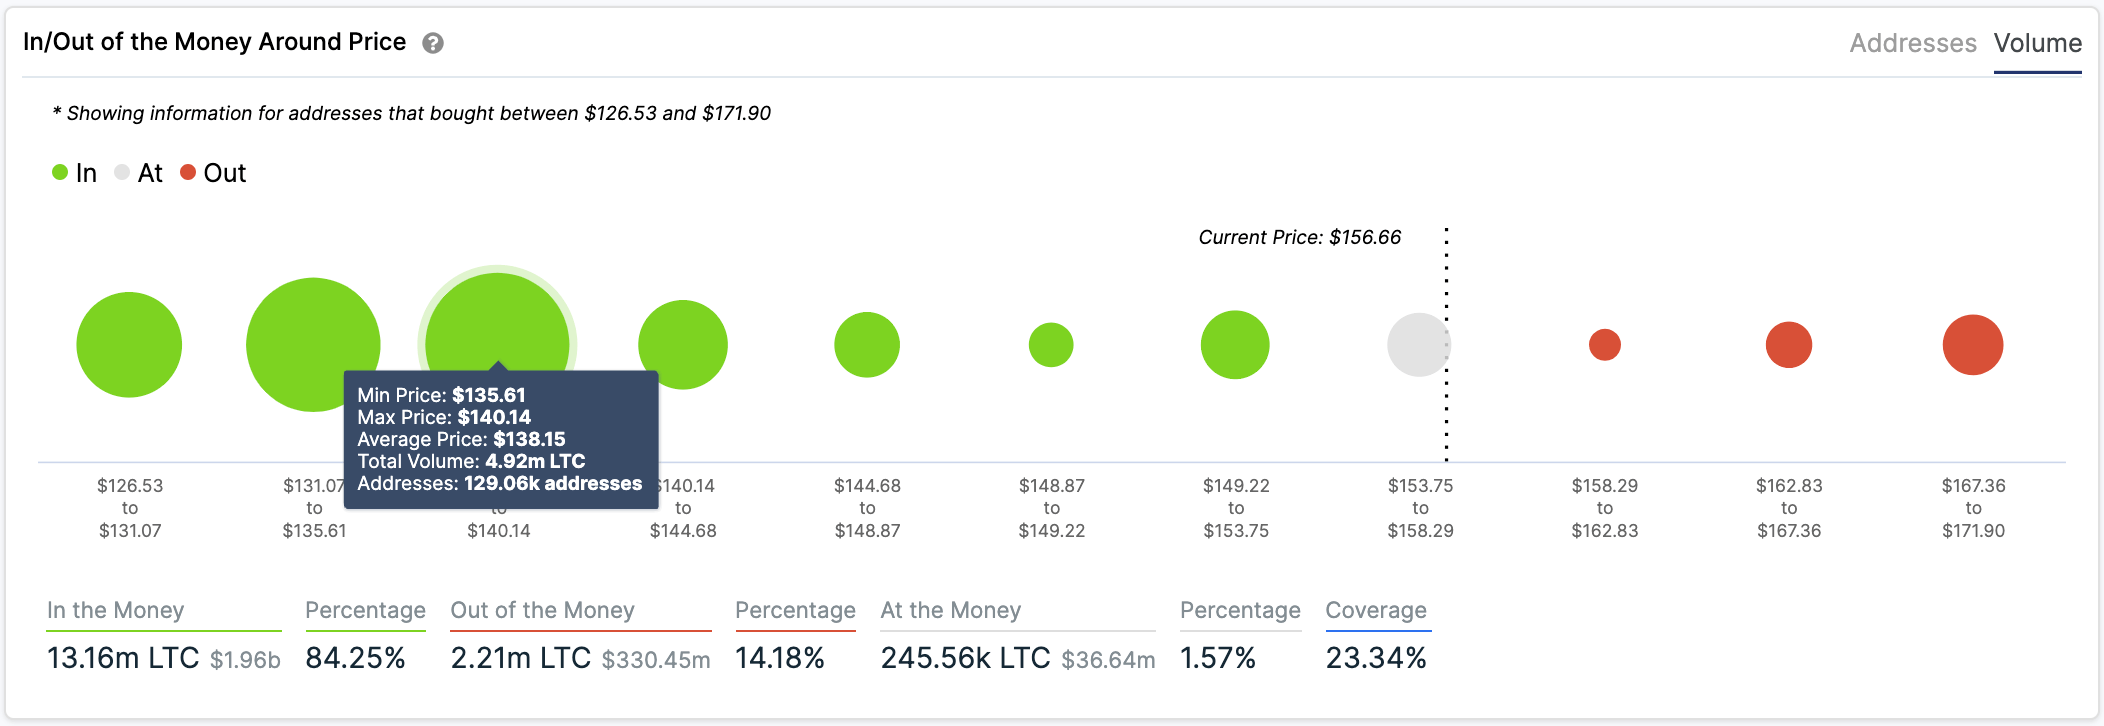
Litecoin IOMAP chart
While everything seems to be looking up for Litecoin price, the bearish outlook cannot be disregarded. A breakdown of the critical support at $135 due to immense selling pressure could invalidate the bullish outlook and open the altcoin for a correction towards $120.
Author

Akash Girimath
FXStreet
Akash Girimath is a Mechanical Engineer interested in the chaos of the financial markets. Trying to make sense of this convoluted yet fascinating space, he switched his engineering job to become a crypto reporter and analyst.


