Litecoin Price Prediction: LTC edges closer to 83% bull rally
- Litecoin price is hovering above two critical demand zones that could propel the coin to new yearly highs.
- A breach of the supply zone’s upper boundary at $317.09 will provide further confirmation of an upswing.
- The bearish scenario will come into play if LTC bears pierce the $210.77 level.

Litecoin price is retracing toward a critical level that could serve as a platform supporting a massive bull rally.
Litecoin price approaches significant area of interest
Litecoin price has shrunk nearly 30% since April 17 and now finds itself at the bottom of the immediate demand barrier that ranges from $240.01 to $259.94. Now, a bounce from this area where buyers are concentrated could provide LTC a thrust to move higher.
In case the sellers break down this level, investors could scoop up Litecoin at a discount around the subsequent demand zone that extends from $219.05 to $228.09.
A potential spike in bid orders that pushes Litecoin price above the two demand zones will confirm the start of an upswing. Under such conditions, LTC could surge 20% toward the upper barrier of the supply zone at $317.09. A decisive close above this level will provide bulls with a path of least resistance that could push Litecoin price toward 161.8% Fibonacci extension at $439.41.
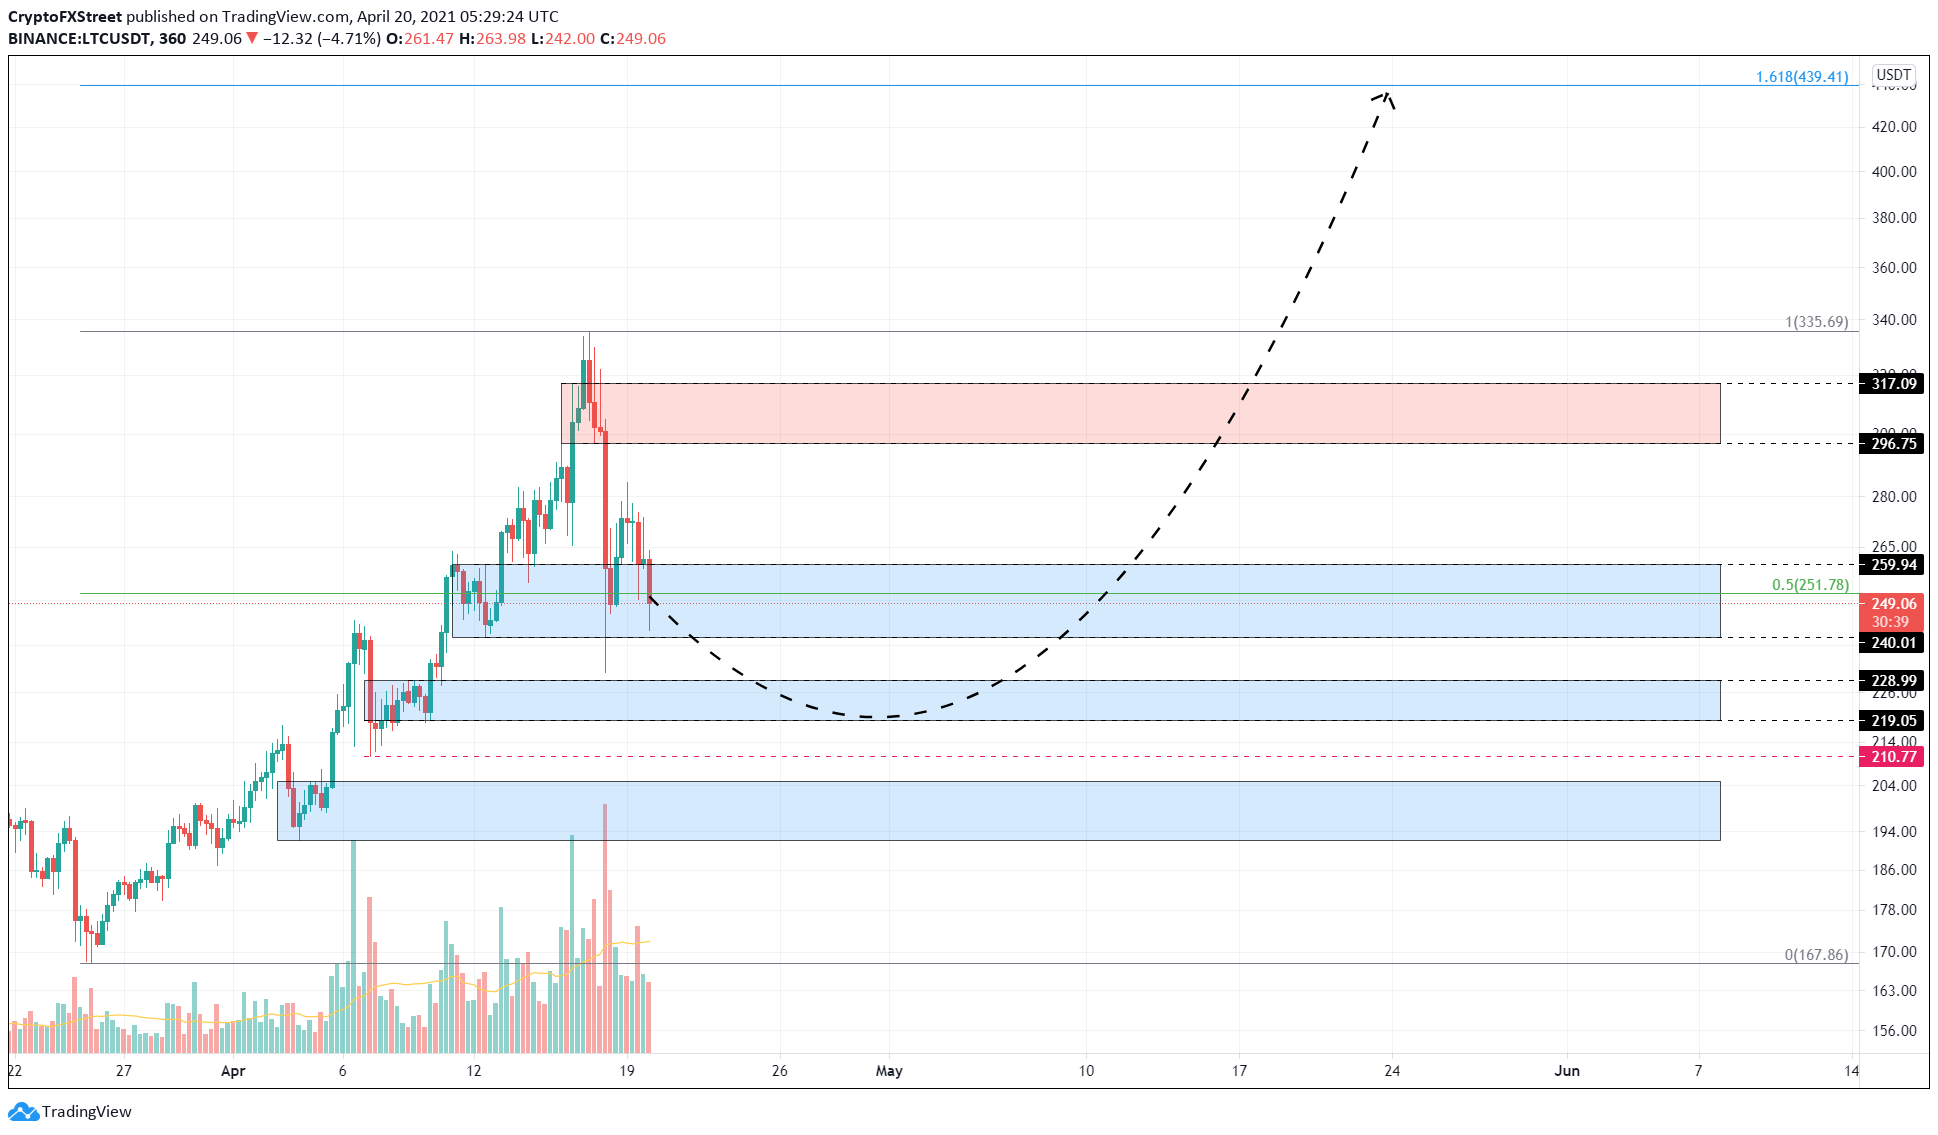
LTC/USDT 6-hour chart
Supporting this bullish narrative is the addition of 12 new whales to the demographic that holds between 10,000 to 100,000 LTC. This 2.8% increase suggests that high net worth investors are confident in Litecoin’s performance in the near future.
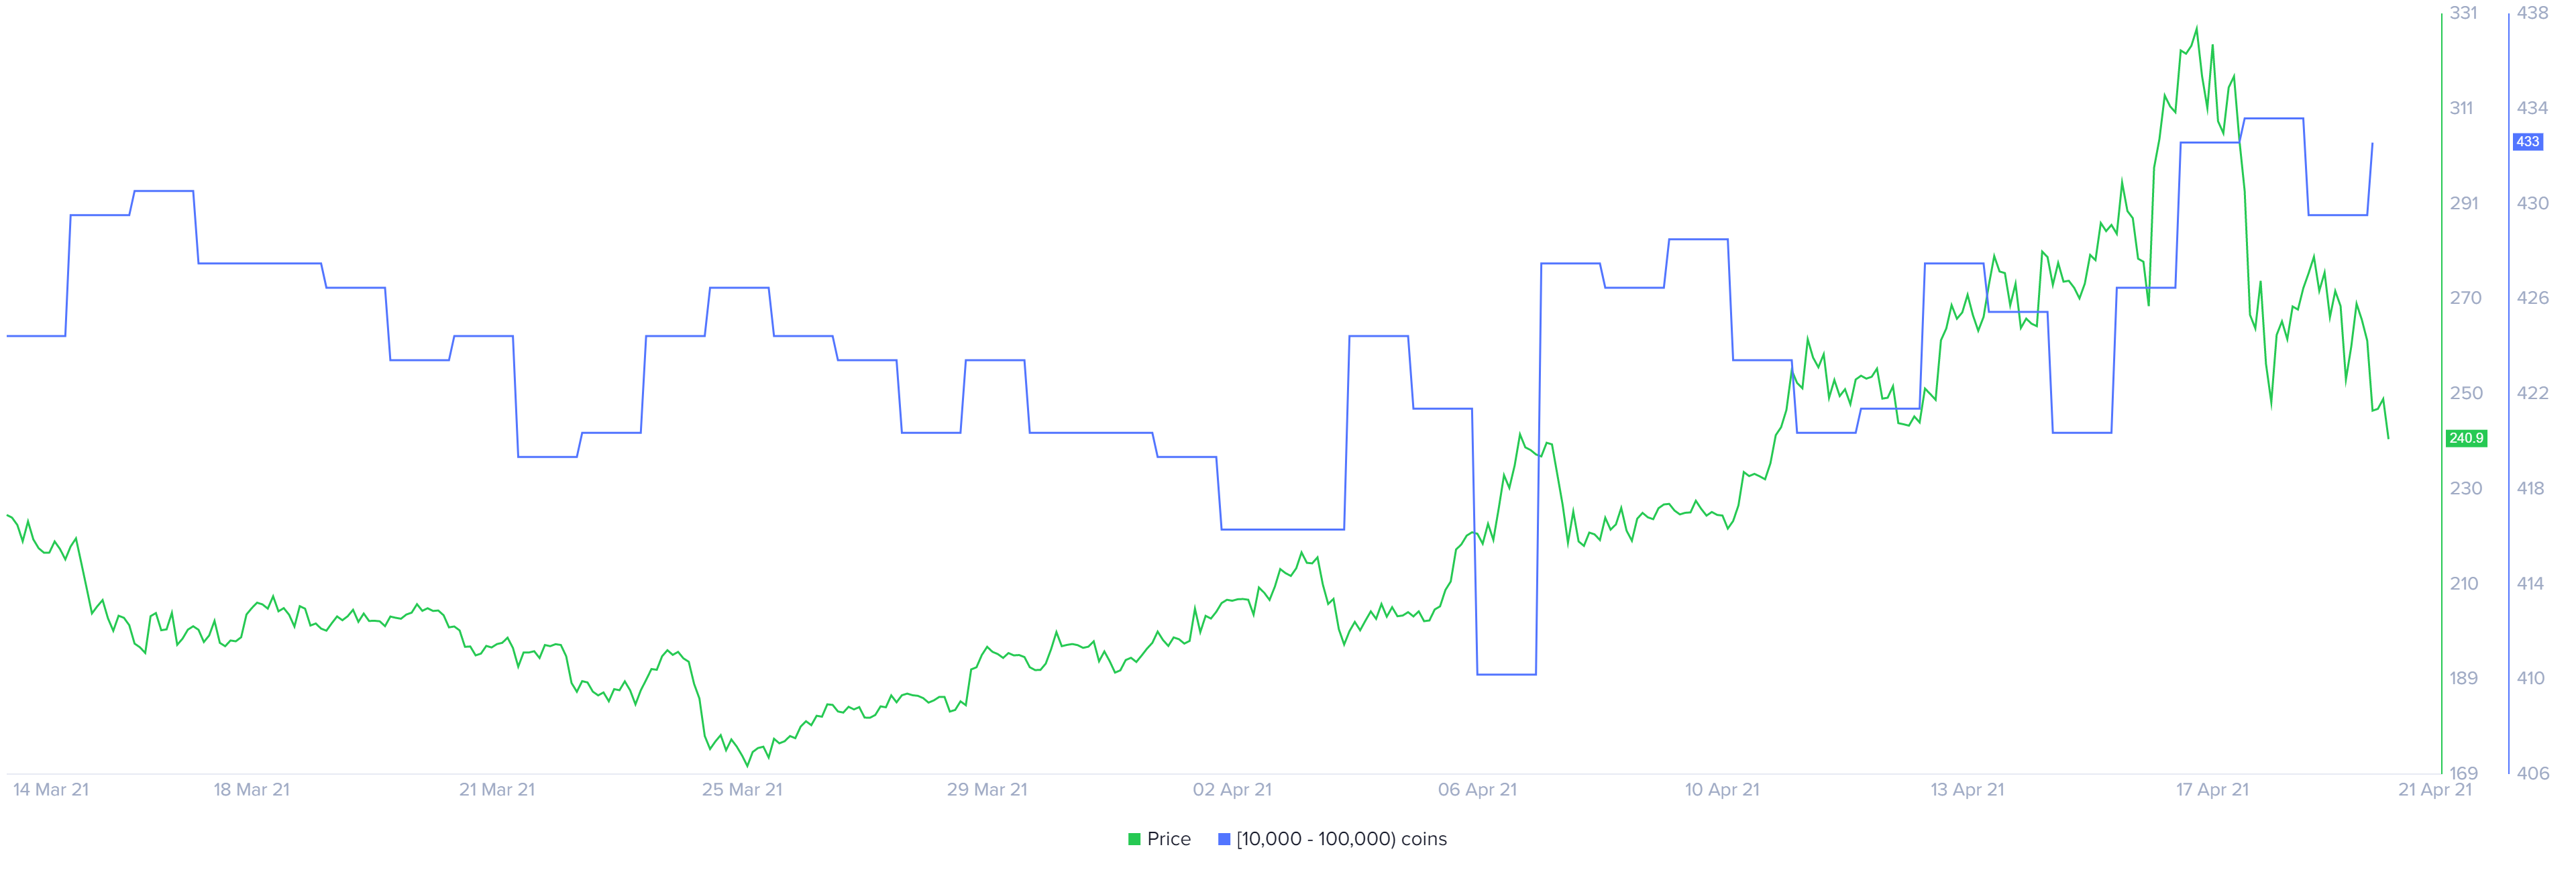
LTC supply distribution chart
Corroborating the above is the reset in Santiment’s 30-day MVRV model for Litecoin price from 29.4% to near zero. This move indicates that profit-taking is coming to an end. Moreover, the MVRV metric suggests that a move below the zero level paints a picture that LTC is undervalued as an investment vehicle.
%20[12.45.44,%2020%20Apr,%202021]-637545023440024594.png)
LTC 30-day MVRV chart
Based on IntoTheBlock’s Global In/Out of the Money (GIOM) model, Litecoin price will face two clusters of underwater investors that may hamper the upswing.
Roughly 163,000 addresses that purchased nearly 3.71 million LTC at an average price of $258.06 are “Out of the Money.” The same can be said for 255,000 addresses that acquired 4.69 million tokens.
Hence, investors need to keep a close eye on these.

LTC GIOM chart
While things seem to be looking up for Litecoin price, a break below $210.77 will put the bullish scenario to an end. If this were to happen, LTC might slide 8% to the subsequent demand barrier at $204.92 or $192.22.
Author

Akash Girimath
FXStreet
Akash Girimath is a Mechanical Engineer interested in the chaos of the financial markets. Trying to make sense of this convoluted yet fascinating space, he switched his engineering job to become a crypto reporter and analyst.



